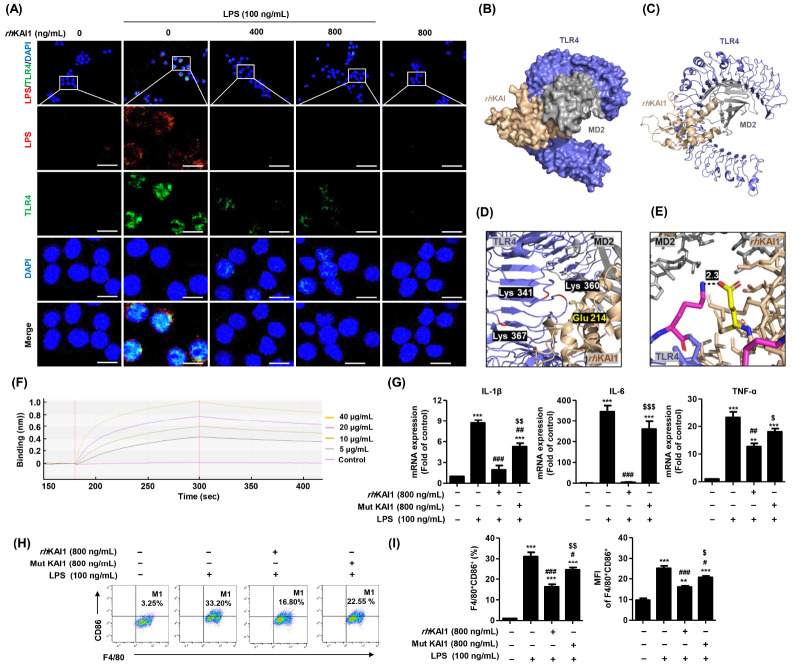
Fig. 3.
rhKAI1 interrupt interaction of LPS/TLR4 complex in LPS-stimulated RAW 264.7 macrophages. (A) The cells were subjected to immunofluorescence staining with LPS and TLR4 specific antibodies. Representative images were acquired using a confocal laser scanning microscopy. Confocal images show the expression of LPS (red), TLR4 (green), and DAPI (blue). Scale bar = 50 μm. The docking conformations of rhKAI1/TLR4 complex are illustrated by the surface (B) and cartoon (C). (D) The interacting residues of rhKAI1/TLR4 complex are shown in cartoon representation. (E) Atoms N and O were marked with blue and pink, respectively. The covalent bound of the rhKAI1 (yellow, Glu 214)-TLR4 (pink, Lys 360) complex and is illustrated by a black dotted line, and its distance is presented. (F) Binding affinity determination for rhKAI1 and rhTLR4 using BLItz label-free biolayer interferometry system. Binding (nm) refers to changes in optical interference. (G-I) Cells were pre-treated with rhKAI1 or mutant (Glu 214) protein of rhKAI1 for 2 h, following by 100 ng/ml LPS treatment for 24 h. (G) Relative levels of mRNA expression for IL-1β, IL-6, and TNF-α was expressed as fold of control. (H) Representative flow cytometry plots of F4/80+CD86+ in RAW 264.7 cells. (I) Quantification and MFI for F4/80+CD86+ cells and F4/80+CD80+ cells from total live-gated cells in RAW 264.7 cells. Data are expressed as the mean ± SD (n = 3). **P < 0.01 and ***P < 0.001 compared to control. #P < 0.05, ##P < 0.01 and ###P < 0.001 compared to LPS-stimulated cells. $P < 0.05, $$P < 0.01 and $$$P < 0.001 compared with LPS+rhKAI1 treatment cells.

