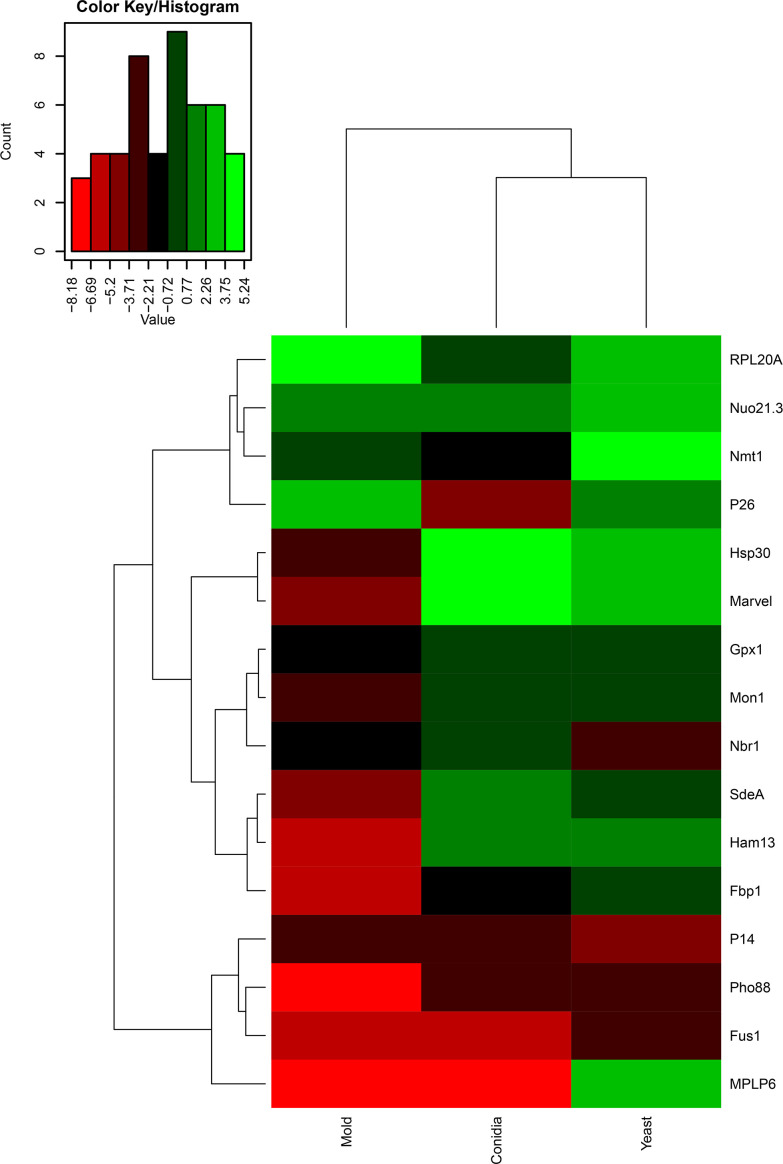
Figure 3.
Heatmap depicted gene expression profile of antigenic encoding genes. The names of the antigenic encoding genes are provided on the right side and growth conditions (conidia, mold, and yeast) are provided on the bottom. Dendrograms are on the left and on top of the heatmap. Gene expression was assessed by qRT-PCR when T. marneffei was grown in different morphologies. Conidia of T. marneffei strain ATCC20051 were inoculated into SDB media and incubated at 25°C (mold) or 37°C (yeast). The 72-h cultures and conidia were harvested, and RNA was prepared (see materials and methods for details). Relative gene expression was calculated by the 2-ΔCt method using actin as a reference gene. Relative fold-change was compared to the phase where the transcript was the lowest. The experiment was performed in three biological replicates. Heatmap was generated using the log2 of relative gene expression values (2-ΔCt). The relative gene expression values without the log2 transformation were represented as a bar graph in Figures 4 , 6 , 7 , 9 – 12 for specified genes.

