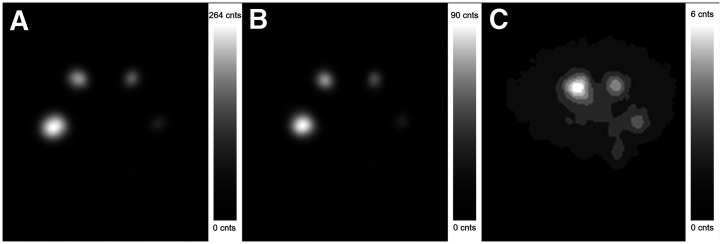
FIGURE 3.
Example of image quality. (A–C) Transaxial slices at each exposure level: 90 kBq/mL (A), 30 kBq/mL (B), and 2 kBq/mL equivalent scan (C), captured using ME collimator and 240-keV window and reconstructed using SC and 12-mm gaussian filter at individually optimal number of iterations. (C) Spheres’ positions are rotated 60° clockwise.

