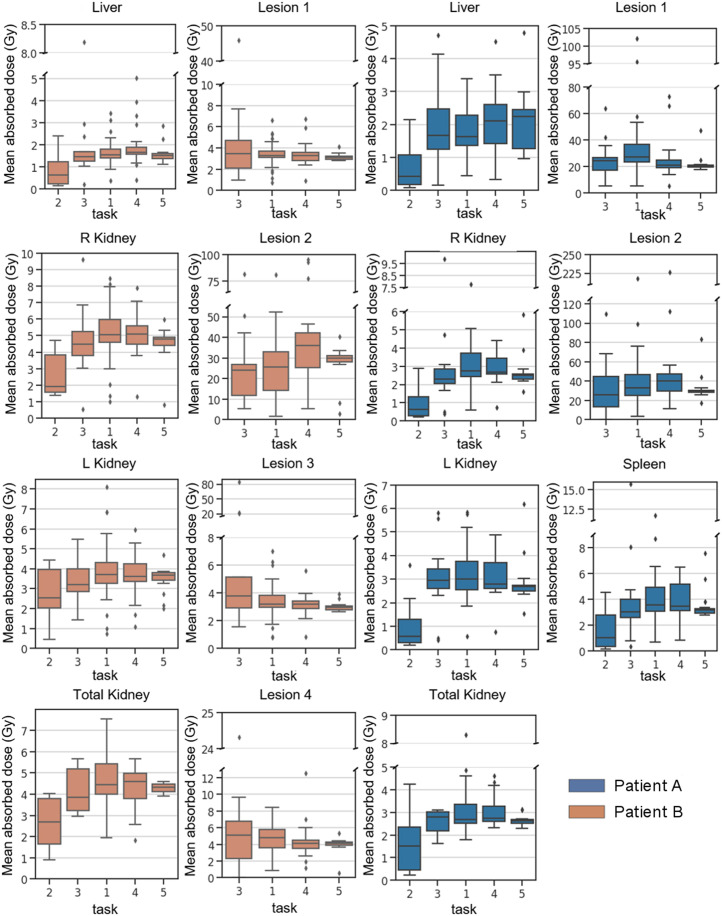
FIGURE 2.
Mean organ and lesion AD in Gray per task and per patient. Patient B had been splenectomized. T2 was based on planar images, T3 used hybrid imaging protocol of multiple planar images and 1 SPECT/CT image, T1 used multiple SPECT/CT images, T4 used multiple SPECT/CT images and provided VOIs, and T5 was based on provided TIA image and VOIs.

