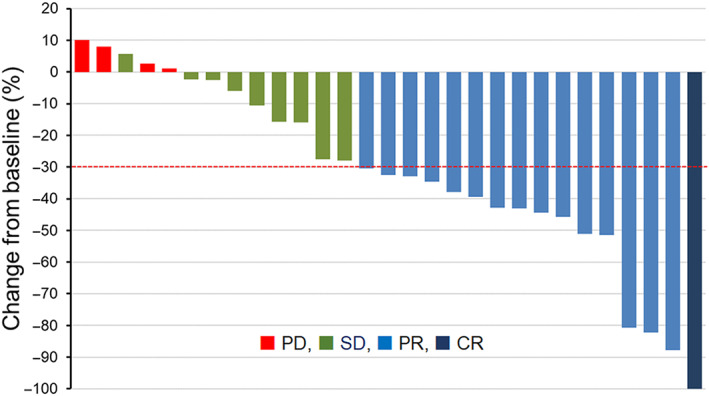
FIGURE 2.

Waterfall plots for the best percentage change in target lesion size from the baseline are shown for all patients. The patterns of each bar indicate the best overall response assessed by the response evaluation criteria in solid tumors version 1.1.
