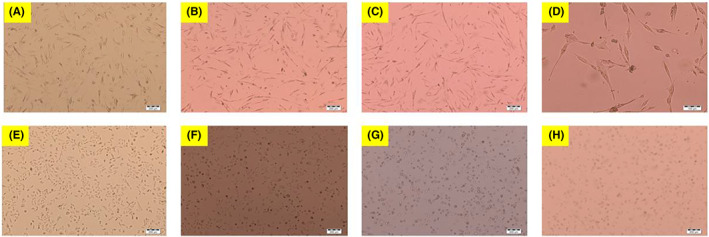
FIGURE 3.

Inverted microscope images of the A549 and CCD‐19Lu cells. A–E: Control, B–F: IC25 Elemi, C–G: IC50 Elemi. D–H: IC75 Elemi‐treated groups. It was observed that the concentration of cells decreased and the number of round and shrunken cells increased in a manner proportional to the concentration in cells treated with elemi. Objective magnification is ×4.
