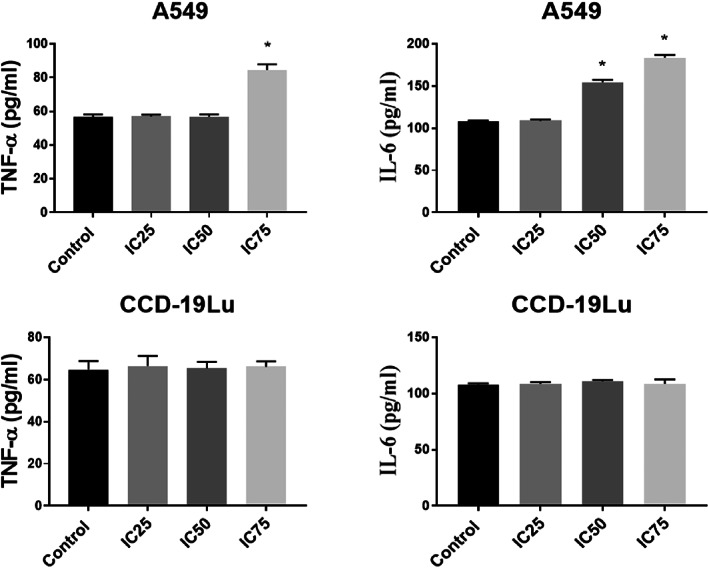
FIGURE 7.

Interleukin‐6 (IL‐6) levels and tumour necrosis factor‐alpha (TNF‐α) in A549 lung cancer cells and CCD19‐Lu treated with different elemi concentrations. *p < 0.05. The data are the average of three sets of 96‐well plate measurements, with a standard deviation shown (n = 3).
