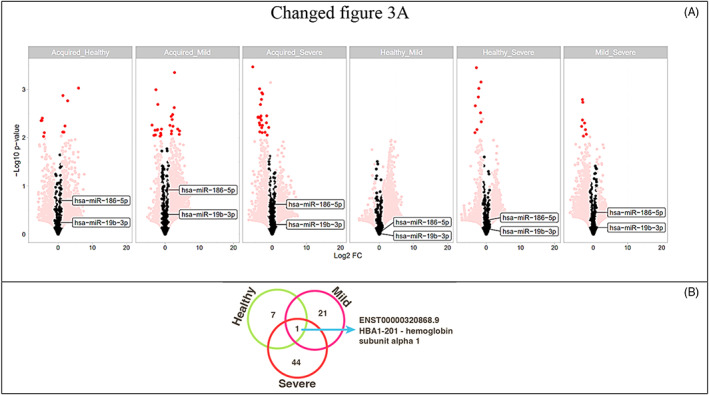
FIGURE 3.

Volcano plots highlighting the global transcriptomic modifications and main altered transcripts (dark red) of all comparisons (A). Venn Diagram depicting the common upregulated transcripts in AH compared to each group. HBA1‐201 – haemoglobin subunit alpha 1 being the common transcript in AH compared to all groups (B).
