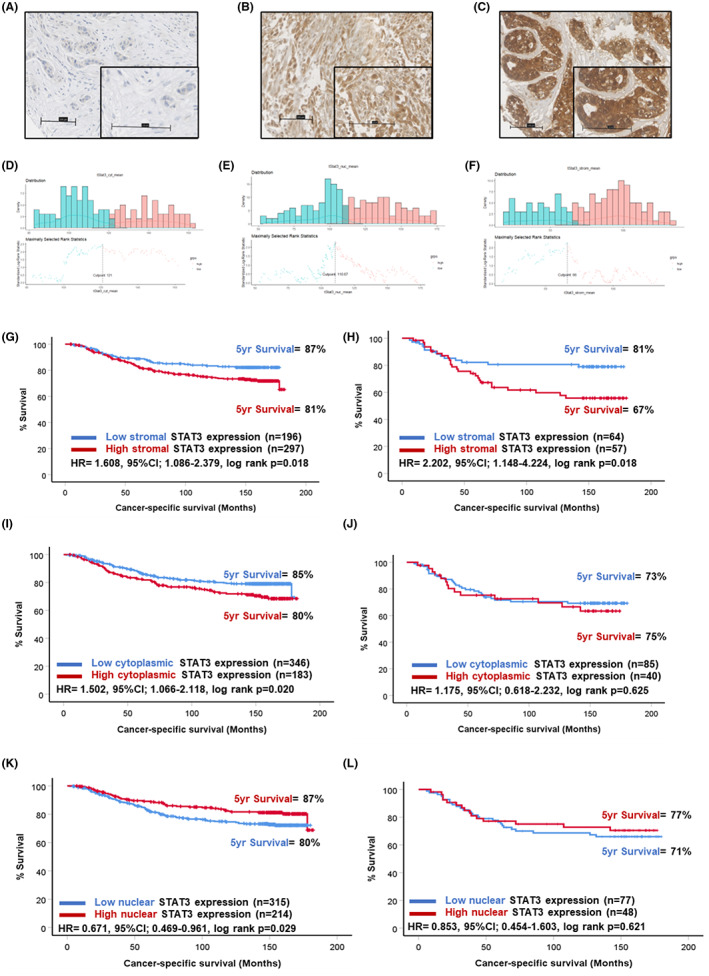
FIGURE 5.

Expression of STAT3 in breast cancer. Representative images showing negative (A) and stromal (B) and tumoural (C) staining of STAT3. Histograms showing the distribution of tumour cytoplasmic (D), tumour nuclear (E) and stromal (F) STAT3 scores and cut‐offs for high and low expression. Kaplan–Meier curves showing the association between stromal STAT3 and cancer‐specific survival across all breast cancer subtypes (G) and in triple negative cases (H). Kaplan–Meier curves showing the association between cytoplasmic STAT3 expression and cancer‐specific survival across all breast cancer subtypes (I) and in triple negative cases (J). Kaplan–Meier curve showing the association between nuclear STAT3 expression and cancer‐specific survival across all breast cancer subtypes (K) and in triple negative cases (L).
