FIGURE 8.

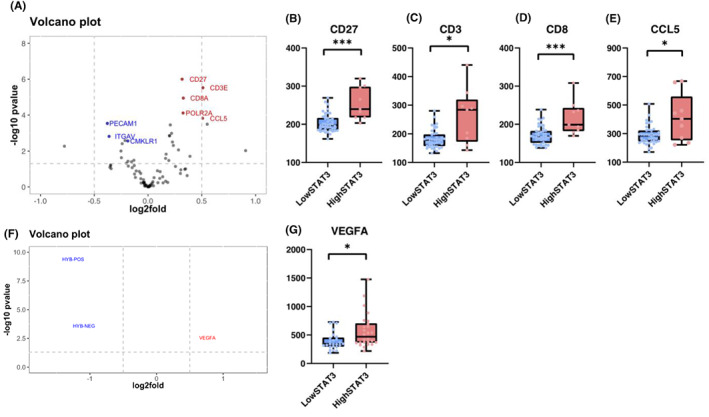
Digital spatial profiling of high/low stromal STAT3 TNBC patients. Volcano plot showing differential gene expression in high/low stromal STAT3 cases from Nanostrong GeoMx profiling of panCK‐negative regions of TNBC patients (n = 14) (A). Box plots showing expression of genes significantly enriched in high stromal STAT3 cases including CD27 (p = 0.0001), CD3 (p = 0.0141), CD8 (p = 0.0005) and CCL5 (p = 0.0397) (B–E). Volcano plot showing differentially expressed genes between high/low stromal STAT3 TNBC cases in panCK‐positive regions (F). Box plot showing the expression of VEGFA relative to stromal STAT3 status (p = 0.0110) (G). *p ≤ 0.05, **p ≤ 0.005, ***p ≤ 0.0005.
