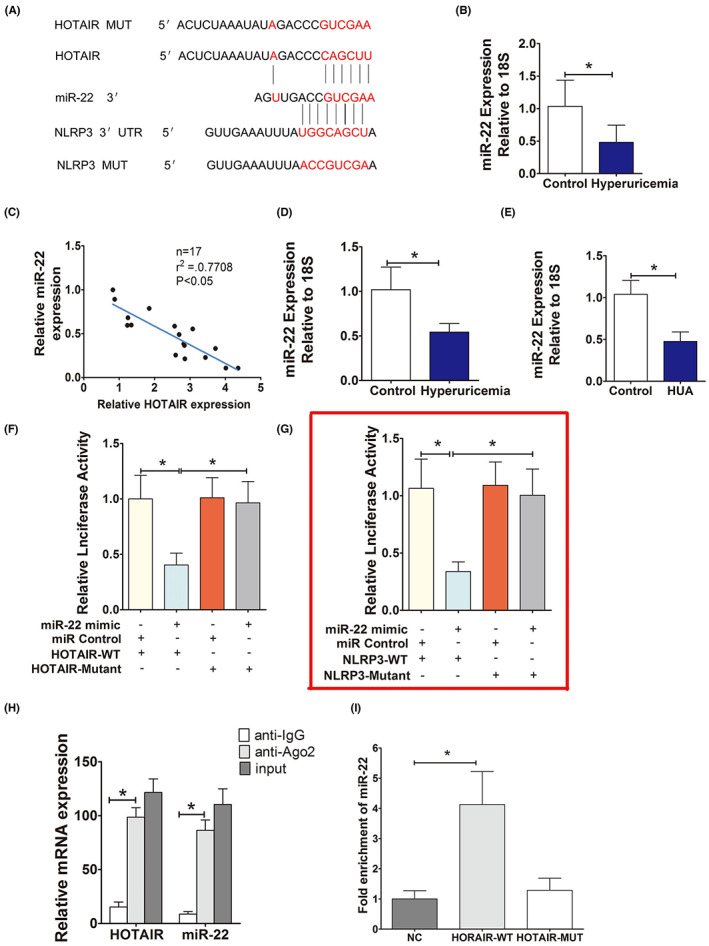
FIGURE 3.

HOTAIR, as a ceRNA, regulates the expression of miR‐22. (A) The sequences of HOTAIR and NLRP3 aligned with miR‐22, including the wildtype (WT) and a mutant. Schematic illustration of the presumed target site for HOTAIR and NLRP3 in miR‐22. (B) Serum levels of miR‐22 in normal controls and hyperuricemia patients, measured by qPCR. The expression of miR‐22 in hyperuricemia group was significantly downregulated and negatively correlated with the expression of HOTAIR; *p < 0.05 compared to the control group; n = 17 in each group. (C) Correlation analysis between HOTAIR and miR‐22 levels in normal controls and hyperuricemia patients. miR‐22 was negatively correlated with HOTAIR (r 2 = −0.77); *p < 0.05 compared to the normal controls; n = 17 in each group. (D, E) The levels of miR‐22 in hyperuricemia mice (n = 6) and HUVECs (n = 3), measured by qPCR. The expression of miR‐22 in HUA mice and HUA‐stimulated HUVECs was significantly downregulated; *p < 0.05 compared to the control group; n = 6 in each group. (F) Luciferase activity results. There is direct binding between HOTAIR and miR‐22; *p < 0.05 versus the mimic NC + HOTAIR‐WT group; n = 3 in each group. (G) Luciferase activity results. miR‐22 directly regulates the expression of NLRP3, *p < 0.05 compared to the mimic NC + NLRP3‐WT group; n = 3 in each group. (H) RIP assays using cell lysate IgG or anti‐Ago2 as the input. Relative expression levels of HOTAIR and miR‐22 in HUVECs were detected by qPCR and normalized to 18 s. The results indicated higher HOTAIR and miR‐22 RNA levels in Ago2 immunoprecipitates relative to control IgG immunoprecipitates; *p < 0.05 compared to the anti‐IgG group; n = 3 in each group. (I) Detections of miR‐22 using qRT‐PCR in the same sample pulled down by biotinylated HOTAIR and NC probe. miR‐22 expression was significantly higher in the HOTAIR‐WT group; *p < 0.05 compared to NC group; n = 3 in each group.
