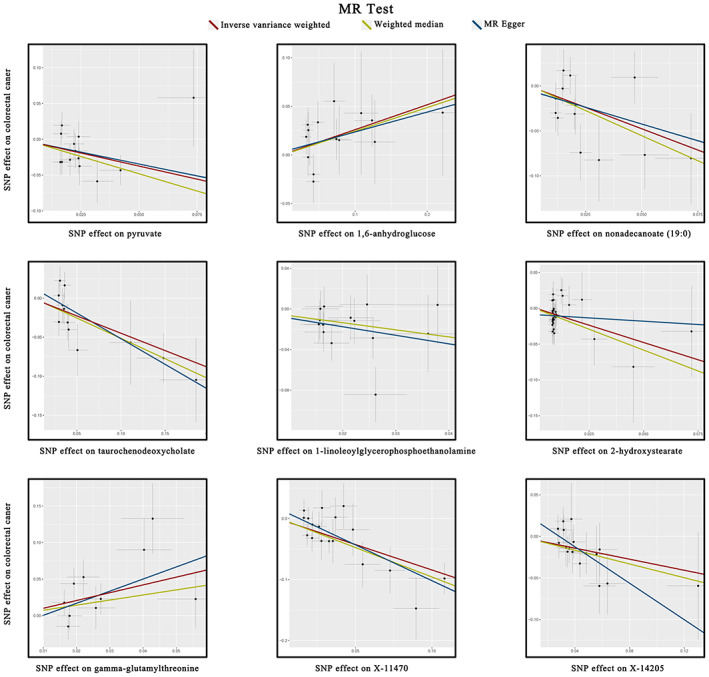
FIGURE 3.

Scatterplot of significantly associated (IVW derived p < 0.05) and directionally consistent estimates. SNP, single nucleotide polymorphisms.

Scatterplot of significantly associated (IVW derived p < 0.05) and directionally consistent estimates. SNP, single nucleotide polymorphisms.