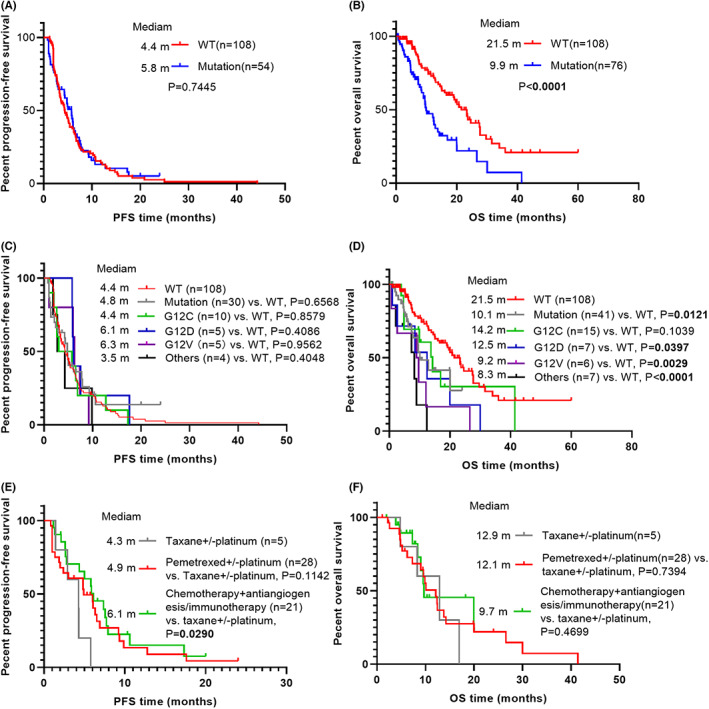
FIGURE 2.

Kaplan–Meier (KM) curves according to different prognostic factors. (A) progression‐free survival curves of all patients stratified by KRAS status; (B) overall survival curves of all patients stratified by KRAS status; (C) progression‐free survival curves of all patients stratified by KRAS mutation subtypes; (D) overall survival curves of all patients stratified by KRAS mutation subtypes; (E) progression‐free survival curves of KRAS‐mutated patients stratified by first‐line treatment; (F) overall survival curves of KRAS‐mutated patients stratified by first‐line treatment.
