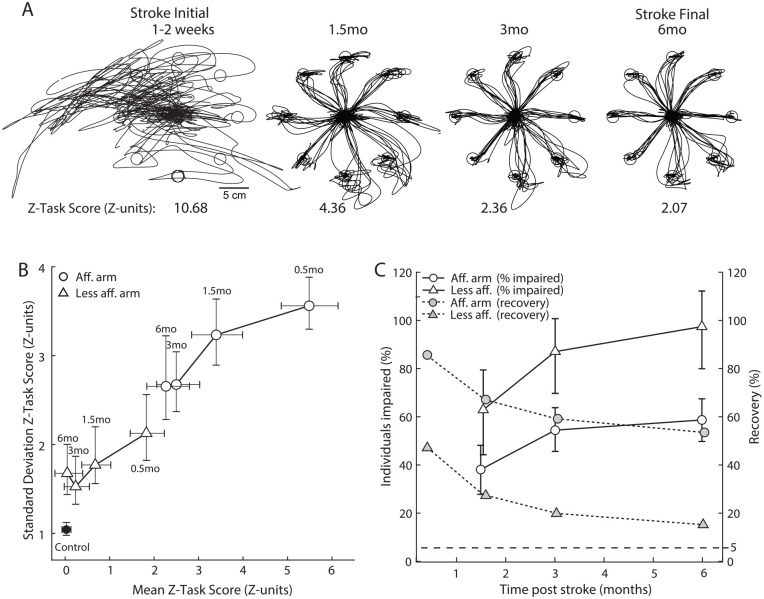
Figure 4.
(A) Hand traces for the VGR task plotted for an exemplar participant assessed at 0.5, 1.5, 3, and 6 months post-stroke. (B) Mean Z-Task Score plotted vs the Standard Deviation of Z-Task Scores. Black circle represents healthy controls, white circles represent the affected arm of participants with stroke and white triangles represent the less affected arm of participants with stroke. Error bars denote 95% confidence interval for the mean and SD estimated by measuring the mean and SD from repeat samples with replacement of Z-Task Scores from the original distribution and repeating this process 1000 times. (C) Left axis: the percentage of individuals classified as impaired based on Z-Task Score (i.e., Task Score higher than 95% of healthy controls). Right axis: % Recovery plotted across time points. Recovery is calculated as the mean of ((Z-Task Score initial—Z-Task Score T(i))/Z-Task Score initial)*100. Circles represent data collected for reaches with the most affected arm and triangles represent data collected for the less affected arm. Errors bars denote 95% confidence interval for recovery based on repeat samples with replacement of individuals from the stroke cohort.).

