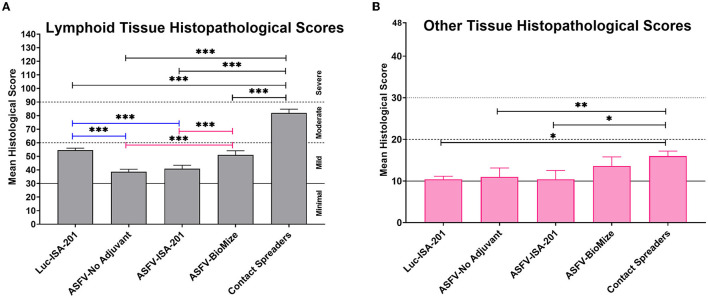
Figure 13.
Tissue histopathology. Mean histological scores per group for (A) lymphoid tissue and (B) other tissues (liver, lungs, kidney, and heart). Group comparisons are indicated by *p = 0.0014, **p = 0.0057, ***p < 0.0001, and any groups not denoted with an asterisk were not statistically significant.

