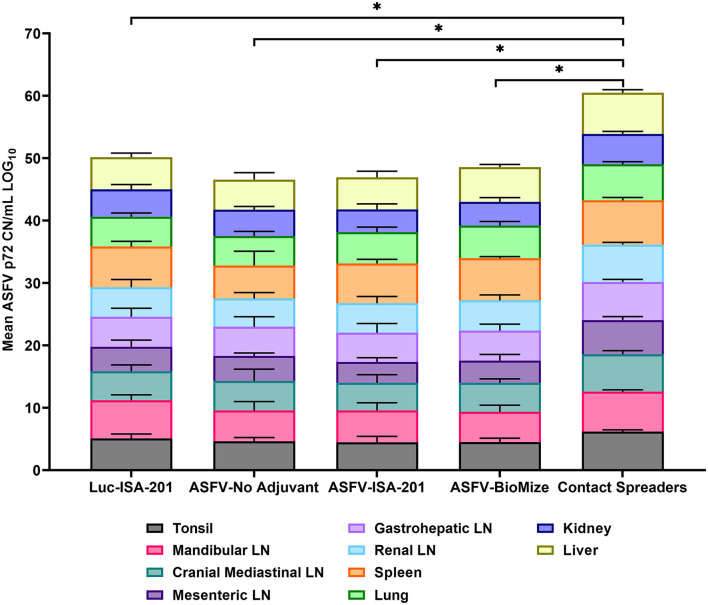
Figure 9.
Viremia in infected tissue. Tissue CN/mL was quantified by qPCR from the samples collected on the day of euthanasia for the vaccinees and Contact Spreaders. Respective tissue types are denoted by separate colors. Each plotted value is stacked and represents the mean for each tissue. The Log base 10 was calculated for each mean CN/mL and plotted in a stacked bar graph with a total score of 100 possible and each individual tissue representative of a score between 0 to 10. Total mean ASFV p72 genomic DNA was statistically significant between the contact spreaders and all other groups denoted by asterisks, *p < 0.0001, any groups not denoted with an asterisk were not statistically significant.

