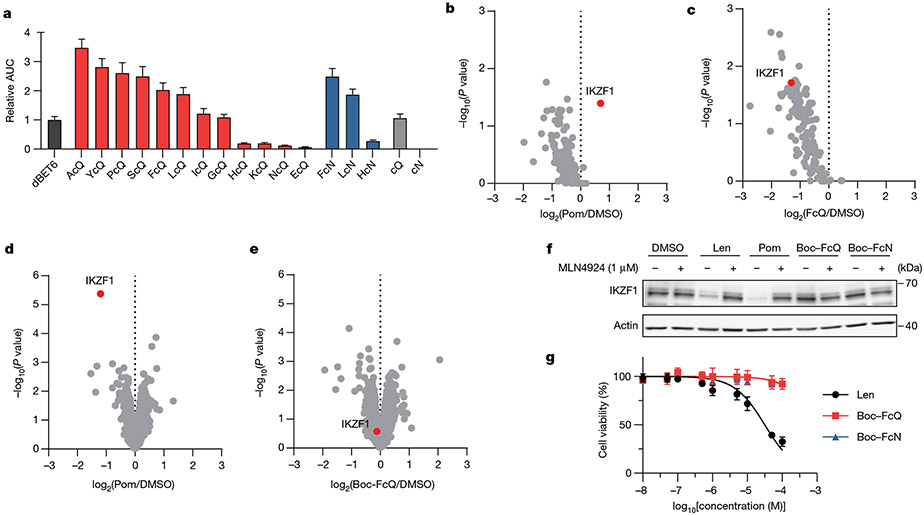
Fig. 2 ∣. Engagement of CRBN and ternary complex formation by dipeptide degraders, but not the dipeptides alone.
a, The relative area under the curve (AUC) from AlphaScreen for ternary complex formation between GST–BRD4(BD2) and His6–CRBN–DDB1 in the presence of the indicated degrader normalized to dBET6. AlphaScreen data are representative of three replicates. Data are mean ± s.e.m. b,c, Quantitative proteomics of co-immunoprecipitated proteins from lysates of HEK-CRBN cells overexpressing IKZF1 after 2 h incubation with 1 μM pomalidomide (Pom) (b) or FcQ (c). Protein concentrations were normalized to the amount of CRBN in each channel. One-way ANOVA with Tukey’s honest significant difference (HSD) post hoc test. d,e, Quantitative proteomics of MM.1S cells after 10 h treatment with 10 μM pomalidomide (d) or Boc–FcQ (e). P-values by t-test (background) method. f, Western blot of IKZF1 after treatment with 10 μM of the indicated compound in MM.1S cells. Western blot data are representative of three independent replicates. Len, lenalidomide. g, Cell viability (MTT) assay of the indicated compounds after treatment of MM.1S cells for five days. Data are mean ± s.d. (n = 4 biologically independent samples). All proteomics experiments were performed in biological triplicates. For uncropped western blot images, see Supplementary Fig. 7.

