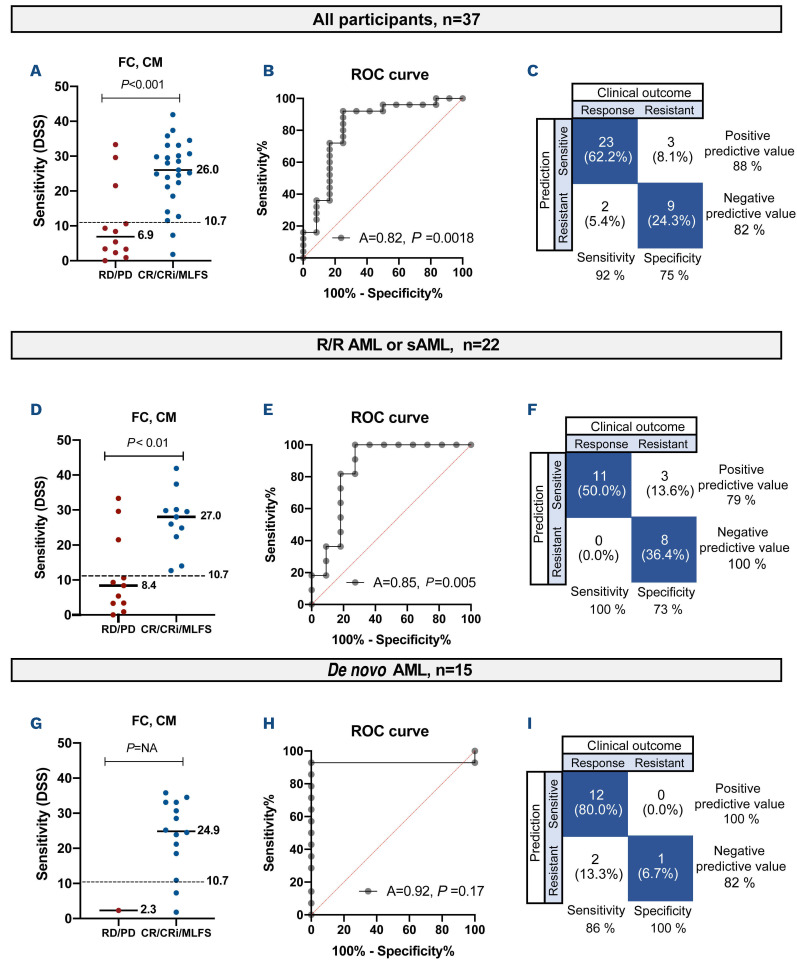
Figure 3.
Determination of the predictive value of drug sensitivity testing in different cohorts of patients. (A) The sensitivity of each participant to venetoclax, determined using flow cytometry and conditioned medium and expressed as a drug sensitivity score (DSS). The participants are divided into responders and non-responders. The dashed line at DSS 10.7 represents the best cutoff value. The P value was calculated using a one-tailed Mann-Whitney U test. (B) Receiver operating characteristic (ROC) curve analysis of DSS and clinical response using the Wilson-Brown method. (C) Sensitivity, specificity, positive predictive value and negative predictive value of the test when using the cutoff value of DSS 10.7, illustrated in a confusion matrix. (D) DSS versus clinical response in relapsed/refractory (R/R) or secondary acute myeloid leukemia (sAML). The P value was calculated using a one-tailed Mann-Whitney U test. (E) ROC analysis of R/R or sAML. (F) Predictive value of the test in R/R or sAML. (G) DSS versus clinical response in de novo AML. The P value was calculated using a one-tailed Mann-Whitney U test. (H) ROC analysis of de novo AML. (I) Predictive value of the test in de novo AML. DSS: drug sensitivity score; FC: flow cytometry; CM: conditioned medium; RD: refractory disease; PD: progressive disease; CR: complete remission; CRi: complete remission with incomplete blood recovery; MLFS: morphological leukemia-free state.

