Figure 3.
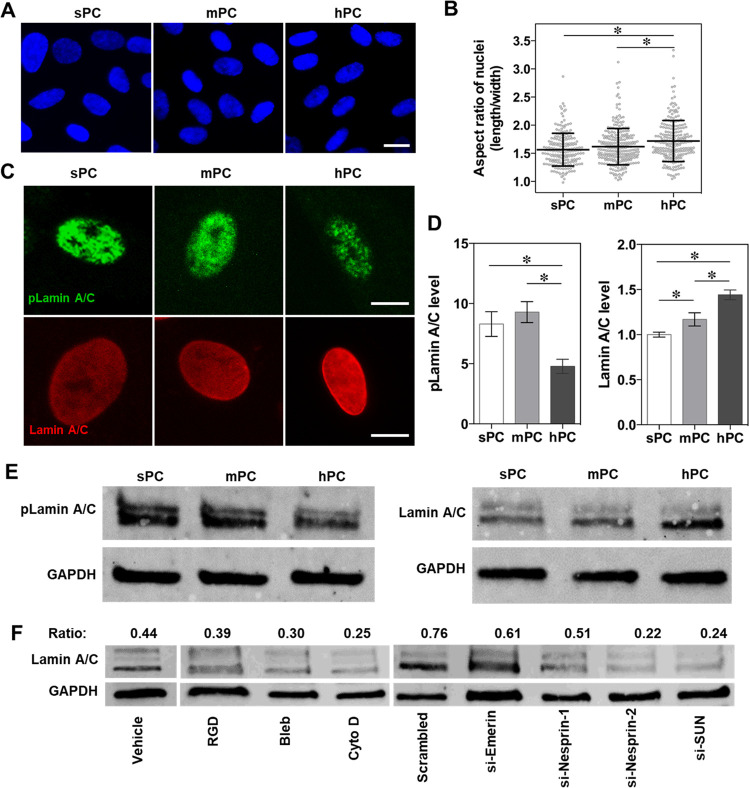
hPC substrate enhances nuclear elongation and Lamin A/C enrichment. The hBMSCs were culture on different substrates in GM for 4 days. (A) Representative cell nuclei staining images of hBMSCs (scale bar = 20 μm). (B) Quantitative analysis of nuclei aspect ratio of cells (nnuclei = 195 (sPC), 251 (mPC), and 219 (hPC); * p < 0.05). (C) Representative immunofluorescence staining images of nuclear pLamin A/C and Lamin A/C of hBMSCs (scale bar = 10 μm). (D, left panel) Quantification of mean fluorescence intensity (MFI) of pLamin A/C based on the staining images (bars show the standard error of the mean (SEM); nnuclei = 35 (sPC), 40 (mPC), and 28 (hPC); * p < 0.05). (D, right panel) Lamin A/C expression level of hBMSCs was quantified using flow cytometry, and the MFI was calculated with Flowjo software. The average value of the sPC group was set as 1 (n = 5; * p < 0.05). (E) Western blot images of pLamin A/C, Lamin A/C, and GAPDH of hBMSCs. (F) Western blot analysis of Lamin A/C. The cells cultured on hPC were treated with inhibitors or transfected with siRNAs. Vehicle and scrambled siRNA groups were served as controls, respectively. The protein amount was analyzed using ImageJ software, and the ratio of Lamin A/C to GAPDH was listed on top.

