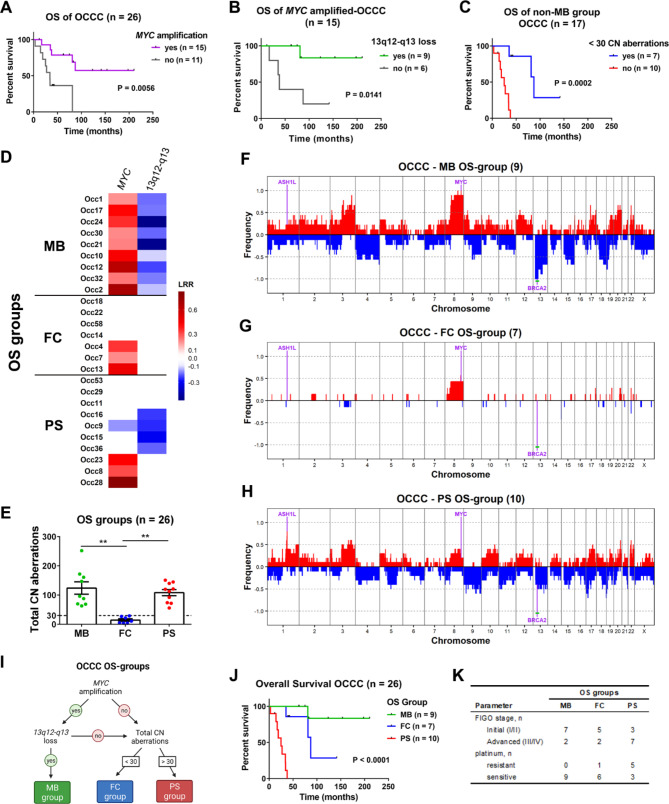
Fig. 3.
Genomic determinants associated with OS outcome in OCCC. Survival data were analyzed in relation to genomic aberrations detected by OncoScan. A Survival analysis showing that amplification of the oncogene MYC is associated with better survival. B Survival analysis showing a subgroup within MYC-amplified OCCCs with better prognosis that was defined by the concomitant loss of chromosome region 13q12-q13, which includes the BRCA2 gene (MB group). C Survival analysis for OCCCs that do not bear concomitant MYC amplification and 13q12-q13 loss (non-MB OCCCs). A subgroup of OCCCs with few CN aberrations shows better survival (FC group). The OCCCs not belonging to either the MB or FC groups that showed the worst survival were named the PS group. D Summary of CN alterations in MYC and 13q12-q13. (E) Graph showing the total CN aberrations of each OS group. The dashed line was set at 30 CN aberrations. Significant differences were analyzed by the Kruskal-Wallis test. F-H Frequency plots were generated for the (F) MB, (G) FC and (H) PS OS groups. Significantly altered genes and regions (green line) are indicated. I Flowchart for the definition of OS groups (created with BioRender.com). J Survival analysis for the OS groups. K Summary of the Figo stage and platinum sensitivity of the samples within each OS group

