Fig. 2.
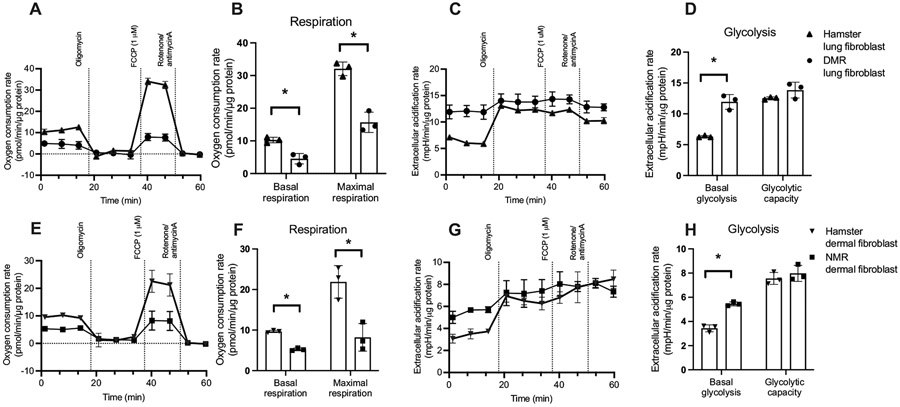
Respiration and glycolysis for (A-D) Damaraland mole-rat (DMR) and Siberian hamster lung fibroblast, and (E-H) naked mole-rat (NMR) and Siberian hamster dermal fibroblast. Seahorse traces for oxygen consumption (A, E) and extracellular acidification (glycolysis; C, G) rate in fibroblasts. B, F: calculated basal and maximal respiration. Basal and Maximal respirations for hamster lung fibroblast were indicated by shaded area in A as an example. D, H: calculated basal glycolysis and glycolytic capacity. Basal glycolysis and glycolytic capacity for hamster lung fibroblast were indicated by shaded area in C as an example. N = 3 independent experiments, Data are shown as means ± s.e.m., * indicates P < 0.05.

