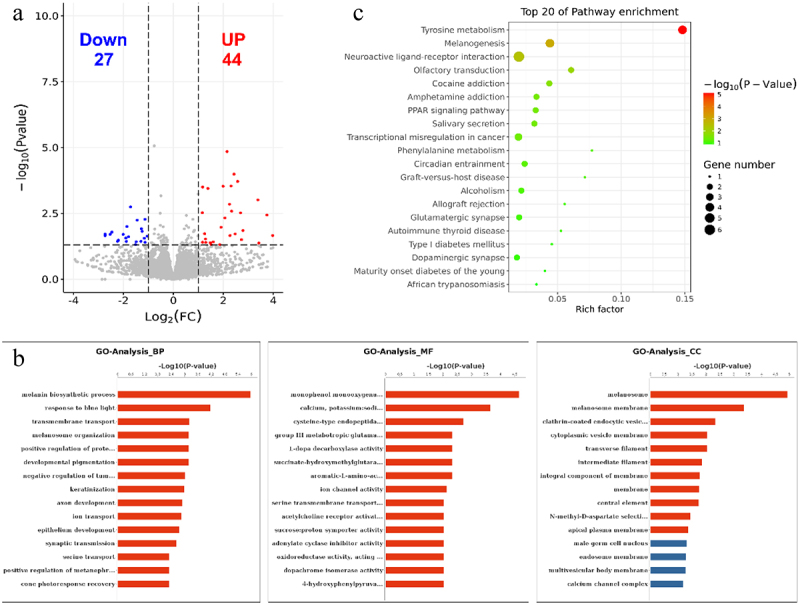
Figure 6.

GO and KEGG analyses of DEGs. (a) Volcano plot showing the differential gene expression in black skin vs. white skin of sheep. (b) Top 20 KEGG pathways enriched for DEGs. (c) Top 15 GO terms of DEGs in three categories (BP, MF, CC). The red column indicates significant enrichment, while the blue column indicates insignificant enrichment.
