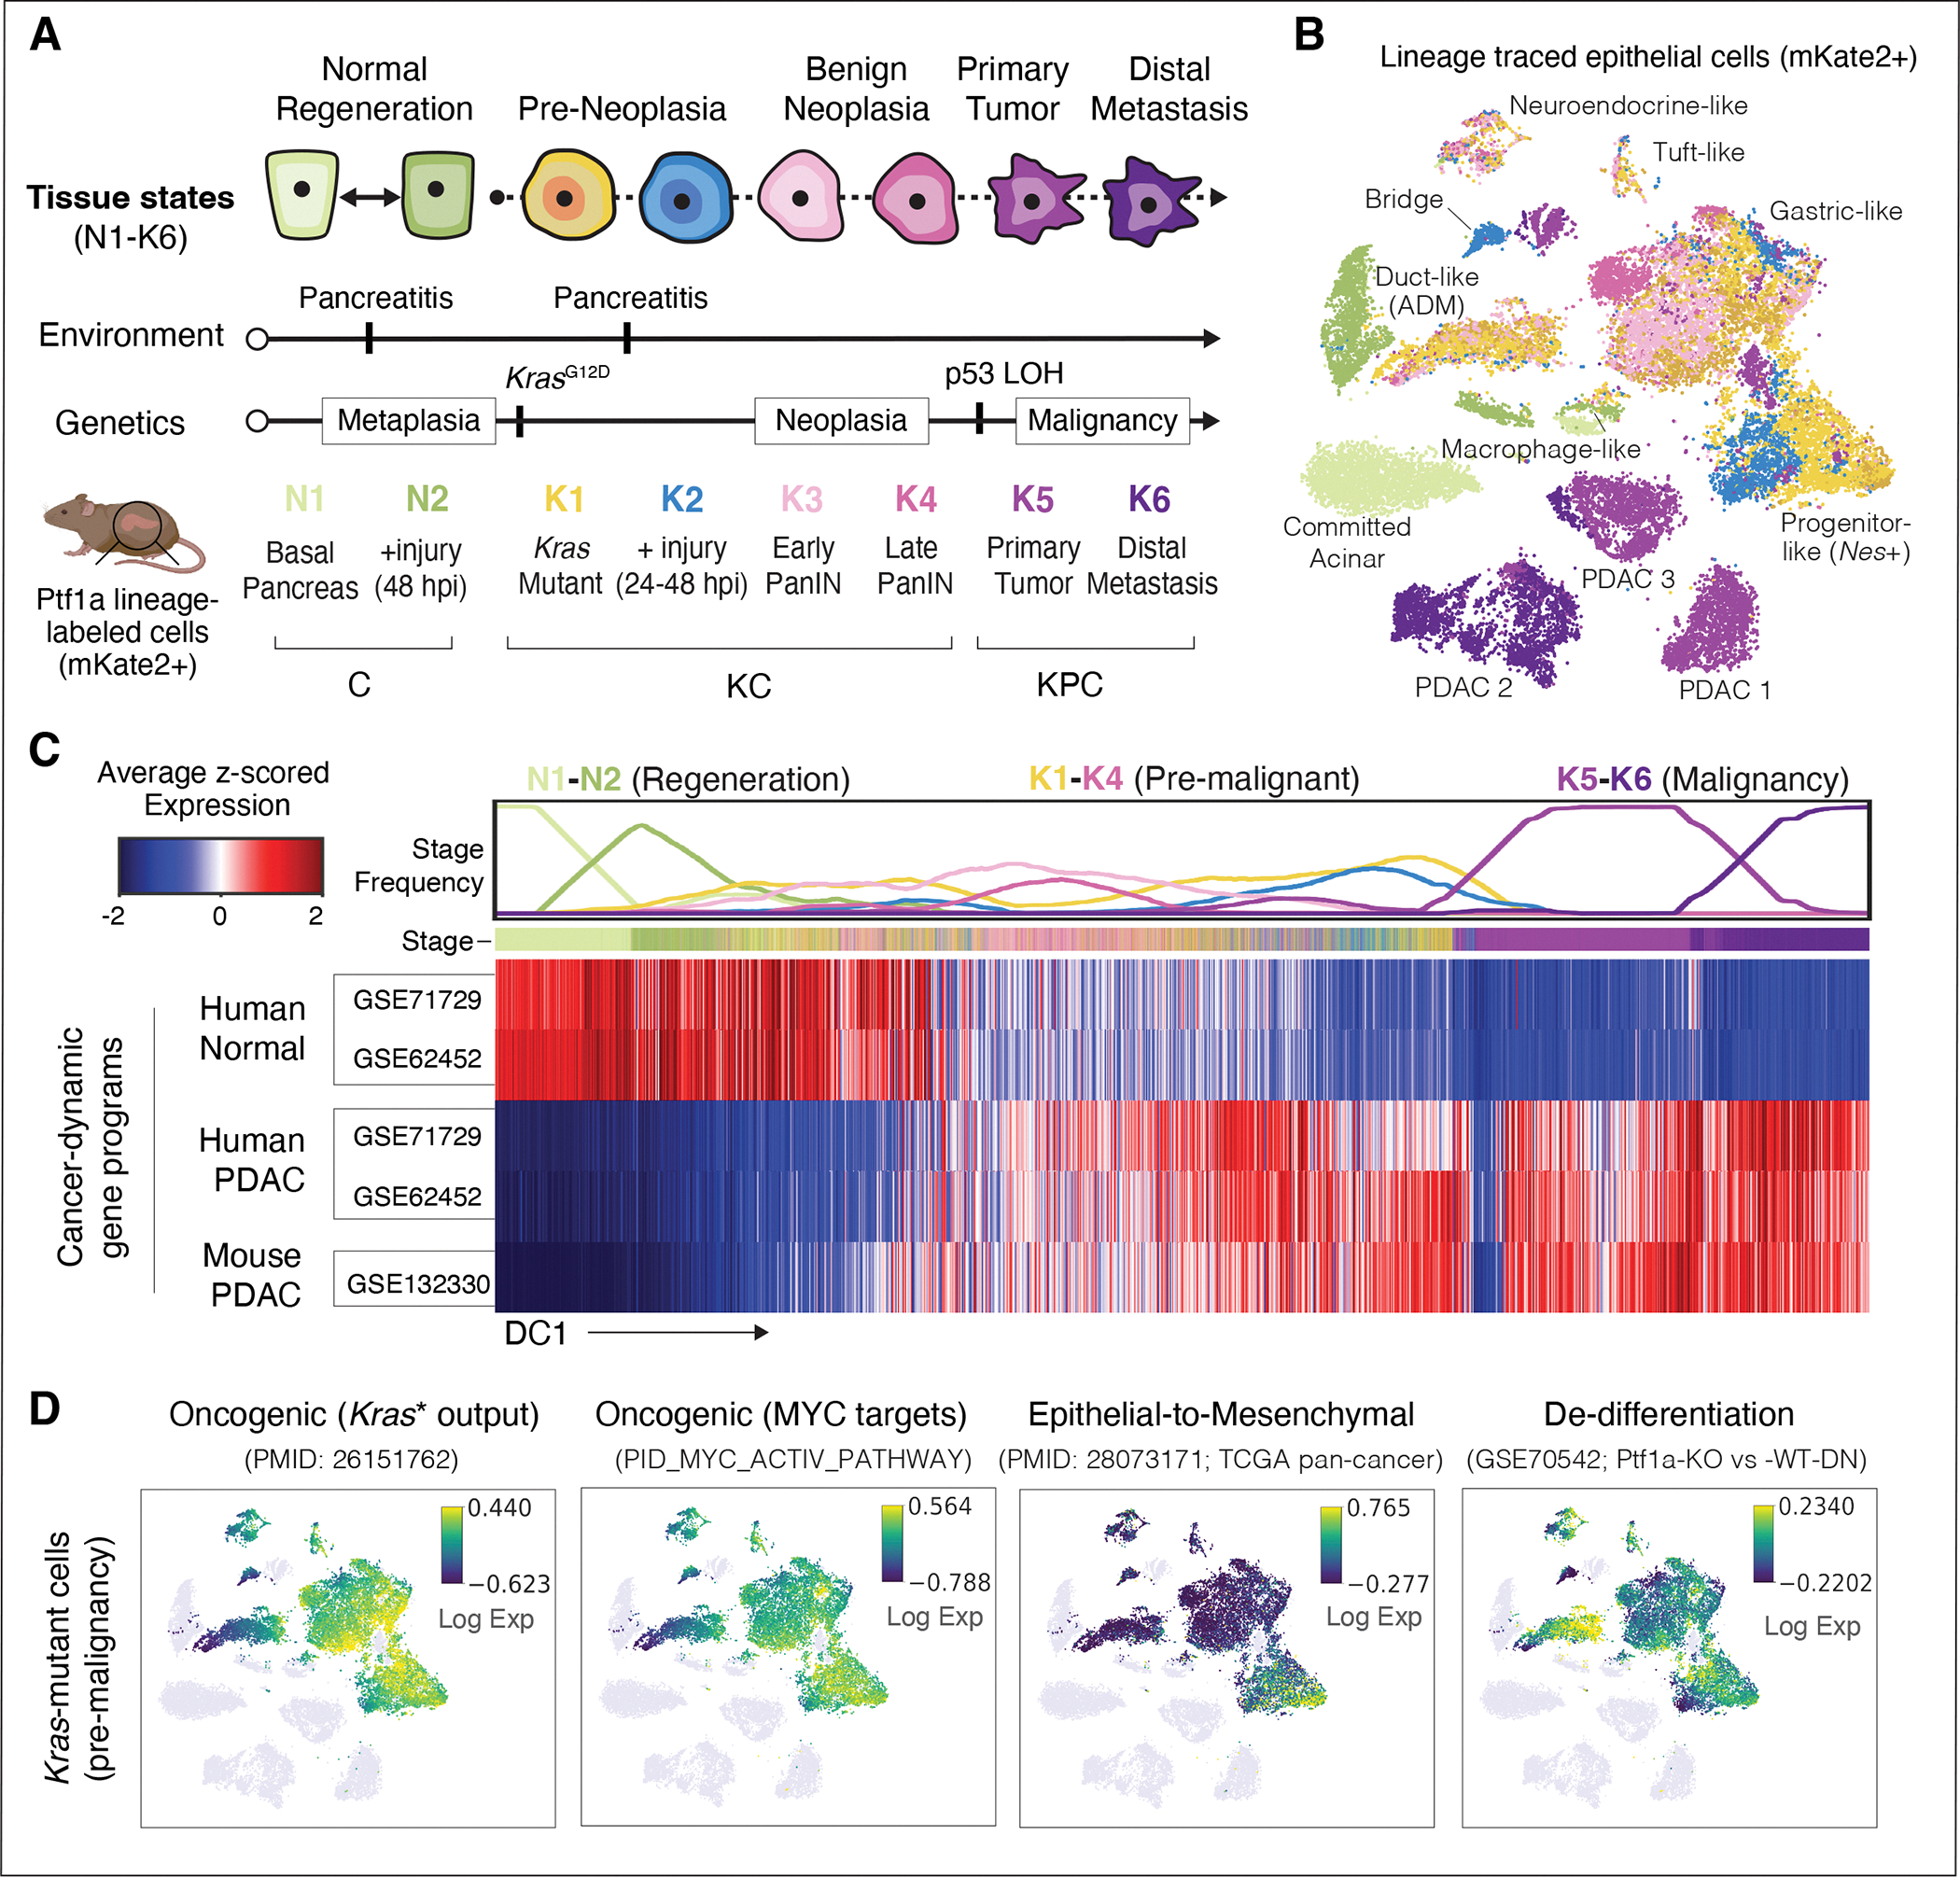
Figure 1. A single-cell transcriptomic atlas of pancreatic regeneration and tumorigenesis.

(A) Experimental design for tissue collection. GEMMs expressing Ptf1a-Cre enable FACS-based enrichment of mKate2-labeled exocrine pancreas epithelial cells (23). mKate2+ cells were isolated from wild-type Kras mice before injury with caerulein (N1) or 48 hours post-injury (N2); and from KrasG12D mice (KC genotype) before injury (K1), and 24–48 hours (K2) or 3 weeks after caerulein (K3, PanIN stage), as well as uninjured older KC mice (K4). PDAC primary tumors (K5) and liver and lung metastases (K6) were harvested from KC mice with a p53 floxed (p53fl/+) or mutant (p53R172H/+) allele (KPC genotype). Mouse illustration was created with BioRender (https://biorender.com/). (B) tSNE visualization of pancreatic epithelial scRNA-seq profiles from all collected stages (n = 17 mice), colored as in (A) and labeled by cell-state (27). ADM denotes cells undergoing acinar-to-ductal metaplasia (31), and ‘Bridge’ denotes cells between acinar-like and malignant programs, which express genes from both. (C) Expression of PDAC-associated gene sets (rows) across all pancreatic epithelial cells (columns) (34, 35). Cells are ordered by the first diffusion component (DC1), representing the major axis of progression from normal (N1) to metastatic (K6) states. Plot at top displays frequency (from 0 to 1) of cells per stage, in bins of n = 2000 cells. Gene set score for each cell is computed as the average of log-normalized expression, z-scored for each gene to obtain a comparable scale. Heatmap is standardized to compare cells within each gene set. (D) tSNE plots as in (B), with pre-malignant (K1–K4) Kras-mutant cells colored by the expression of genes (from left to right) upregulated in bulk RNA-seq of Kras-mutant (Kras*) pancreas relative to normal (67), associated with Myc activity (68), EMT (36), or down-regulated upon Ptf1a knockout (67). Colors are scaled from 5th to 95th percentile of expression.
