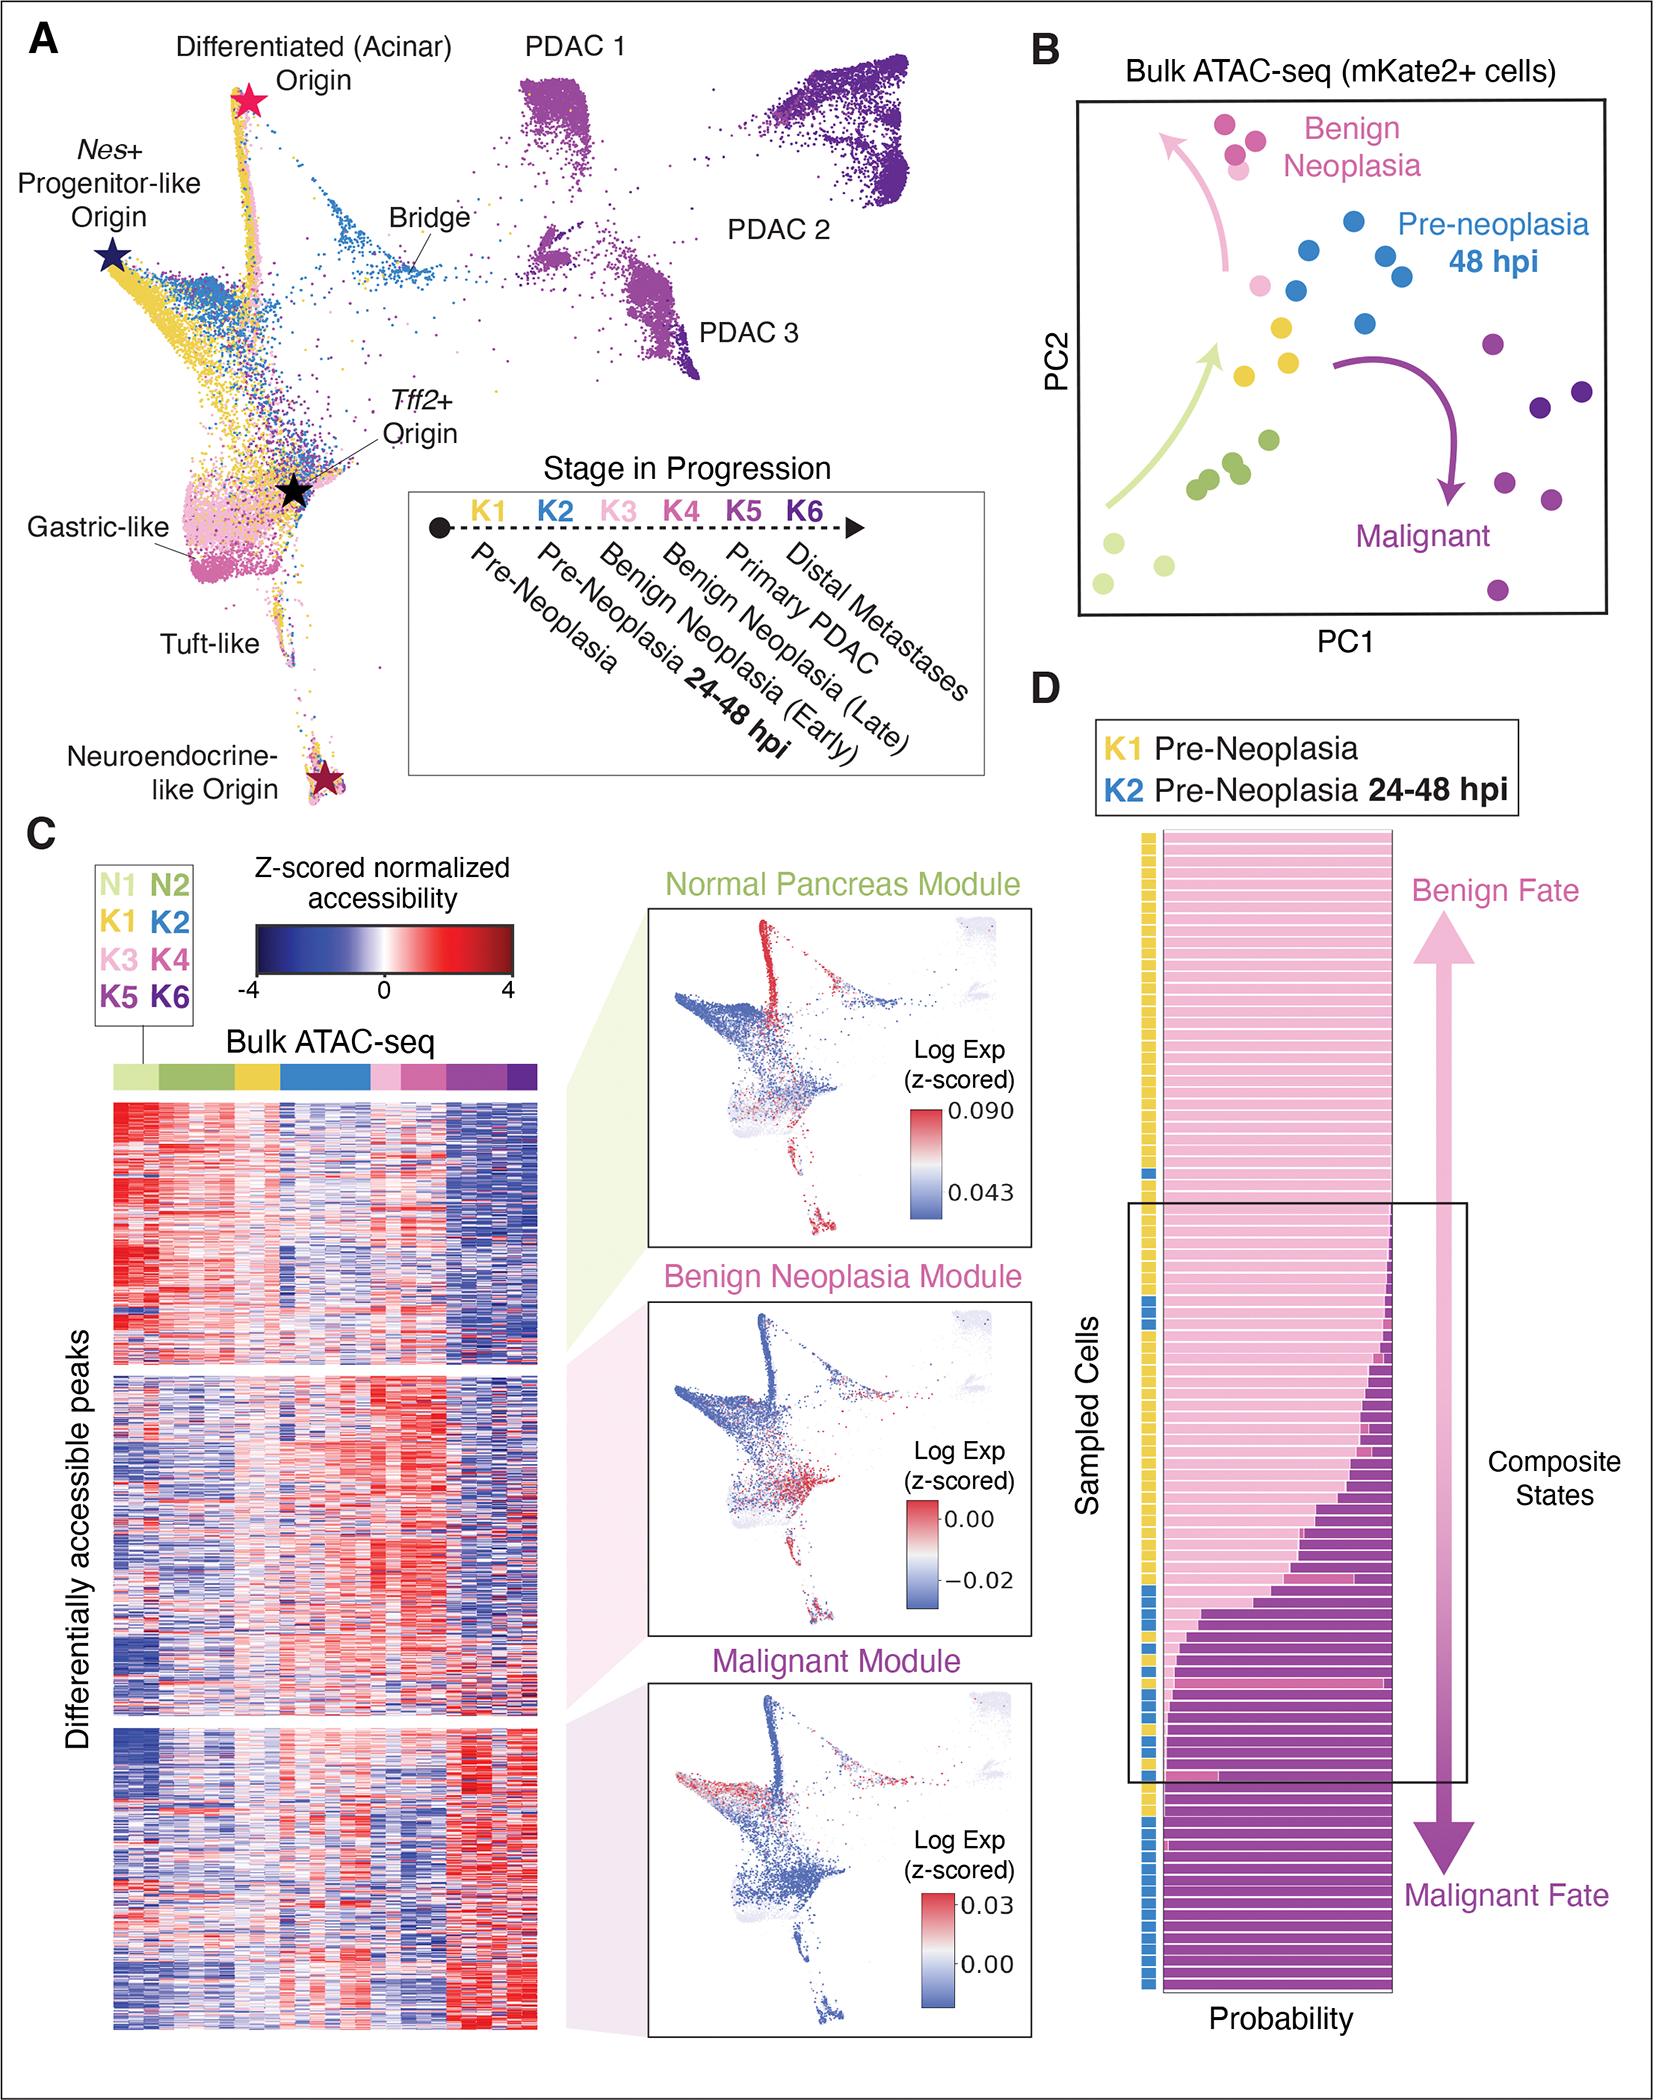
Figure 2. Differential epigenetic priming of Kras-mutant cells.

(A) Force-directed layout (FDL) of all Kras-mutant scRNA-seq profiles (K1–K6, n = 11 mice). Cells colored by stage as in Fig. 1A. Stars highlight ‘apex’ states inferred by CellRank (39) (see Fig. S3B). (B) Principal component analysis (PCA) of bulk ATAC-seq profiles from pancreatic epithelial cells. Each point shows the position of a single biological replicate (individual mouse), colored by stage as in (A). Arrows indicate a transition upon injury and Kras mutation (N1-N2, K1-K2; green arrow) and a divergence between benign neoplastic (K3-K4; pink arrow) and malignant (K5-K6; purple arrow) stages. (C) Left: Chromatin accessibility along progression. Subsets of differentially accessible ATAC-seq peaks (rows) are organized into three modules by clustering (27); bulk ATAC-seq replicates (columns) are ordered and colored by stage as in (A). Peaks organize into distinct accessibility patterns, denoted as chromatin modules (27). Right: Expression of genes corresponding to chromatin accessibility modules in pre-neoplastic cells (K1, K2). FDL map as in (A), colored by module expression score computed by z-scoring each cell to emphasize dominant gene programs per cell, and averaging genes nearest to module peaks. Color (expression scores) are scaled between the 40th and 90th percentiles. (D) Probability of classifying pre-neoplastic cells (K1, K2) as more similar to benign neoplastic (K3-K4) or malignant (K5-K6) scRNA-seq profiles, based on expression similarity. Sampled cells (rows) are ordered from highest benign fate probability (top) to highest malignant fate probability (bottom); bars represent probability of classification from 0 to 1 to K3, K4, K5, or K6 labels, colored as in (A). A fraction of cells exhibit composite states with probability for both fates.
