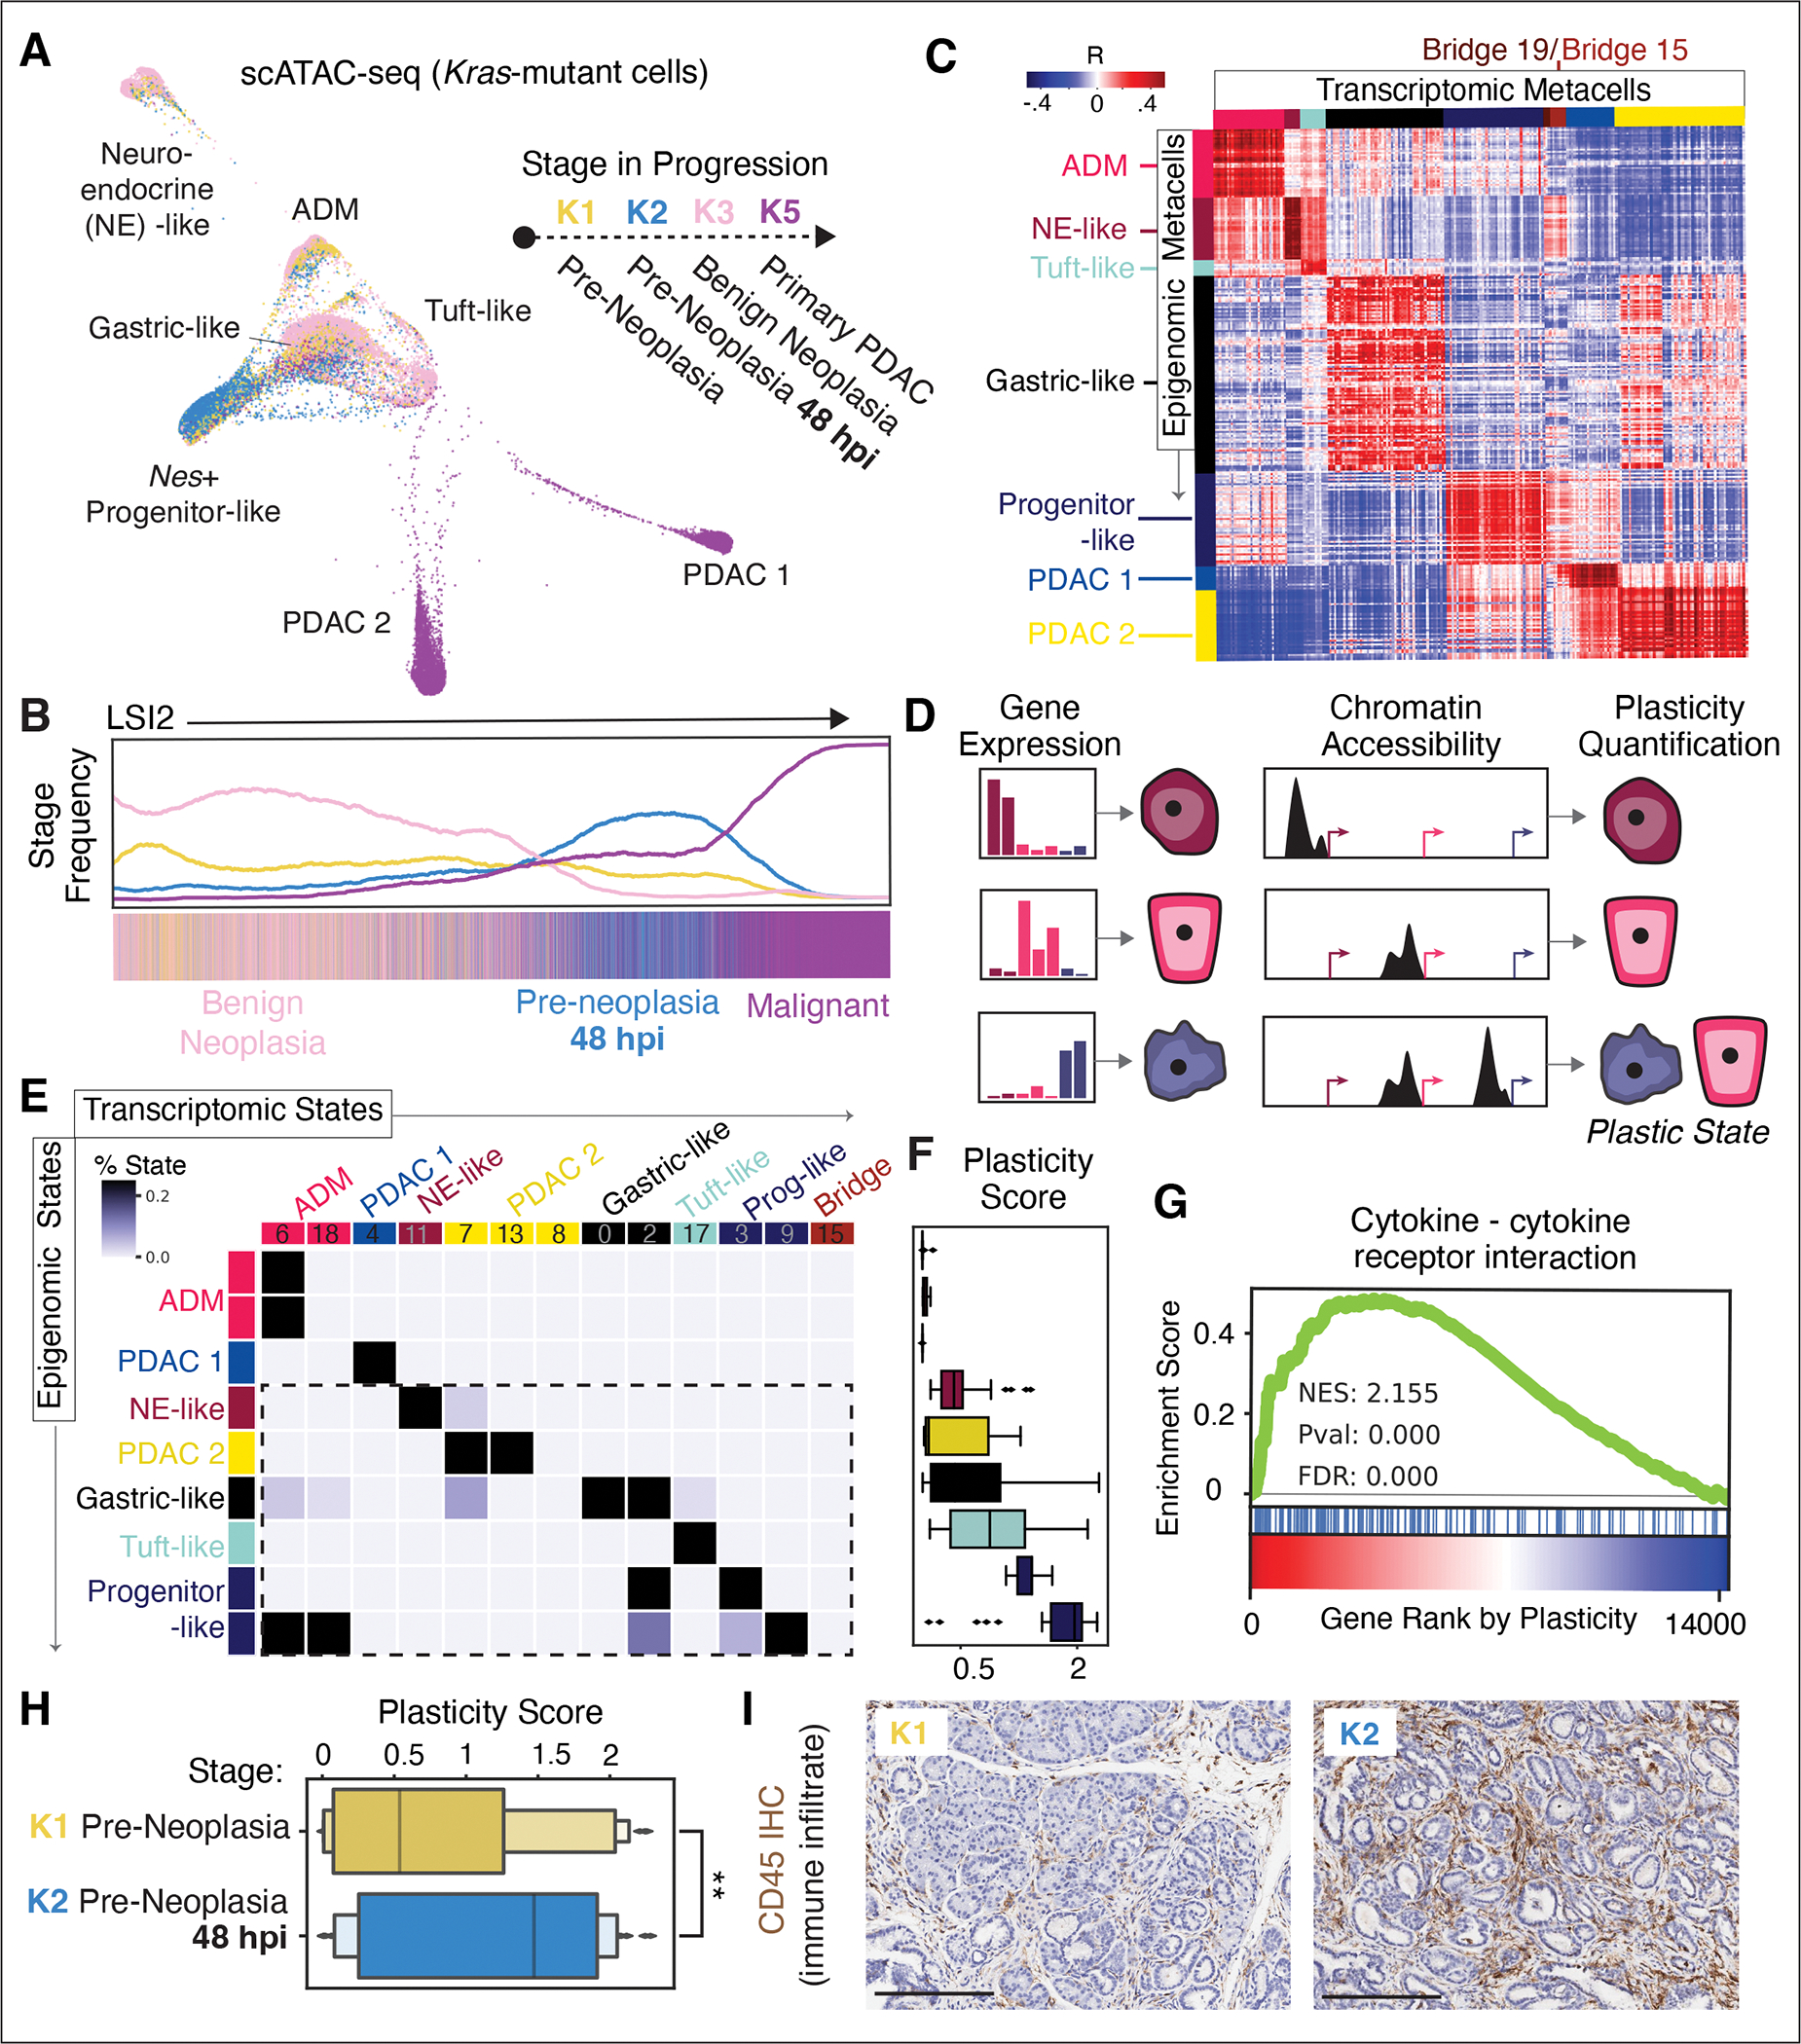
Figure 3. Kras-mutant cells display elevated epigenetic plasticity, which is associated with cell-cell communication propensity.

(A) FDL of scATAC-seq profiles from Kras-mutant epithelial cells from pre-malignant (K1–K3) and malignant (K5) stages (n = 9 mice), colored by stage. (B) Frequency of cells from each stage along second high-variance component from latent semantic indexing (LSI) of scATAC-seq profiles (65). (C) Pairwise Pearson correlation coefficients of metacells from scATAC-seq ArchR gene accessibility scores (rows) and scRNA-seq expression values (columns). Annotated cell-states, determined by refined PhenoGraph clustering of scRNA-seq (Fig. S1C) and scATAC-seq (Fig. S5A), are colored according to their annotation as in labels from (A). Blocks of positive correlation along diagonal represent similar cell-states across the two modalities, whereas off-diagonal correlations indicate similarity across distinct cell-states. (D) Cartoon of classifier-based approach to quantify plasticity (27). (E) Classifier confusion matrix based on procedure in (D). Cell-states, determined by scRNA-seq (Fig. S1C) and scATAC-seq (Fig. S5A) metacell clusters, are colored as in labels in (A). Values represent number of metacells from an epigenomic cluster that classify to a transcriptomic cluster, normalized within each row. Dashed box highlights high plasticity epigenomic states. (F) Plasticity scores for epigenomic clusters in (E). Boxes represent interquartile range (IQR) of plasticity scores for all epigenomic metacells assigned to that cluster, computed as per-cell Shannon entropy in the classifier’s predicted probability distribution across transcriptomic states. Lines represent medians and whiskers represent 1.5x IQR. (G) GSEA plot based on Spearman rank correlation between plasticity score and each gene’s accessibility score. (H) Plasticity scores for epigenomic metacells from K1 and K2, showing significant increase in plasticity in K2 (one-tailed t-test; t = 2.5511, p value = 0.006). (I) Immunohistochemistry of CD45 (brown) marking immune cells in K1 and K2 tissue, showing increase in immune infiltrate in response to injury. Scale bar, 200 μm.
