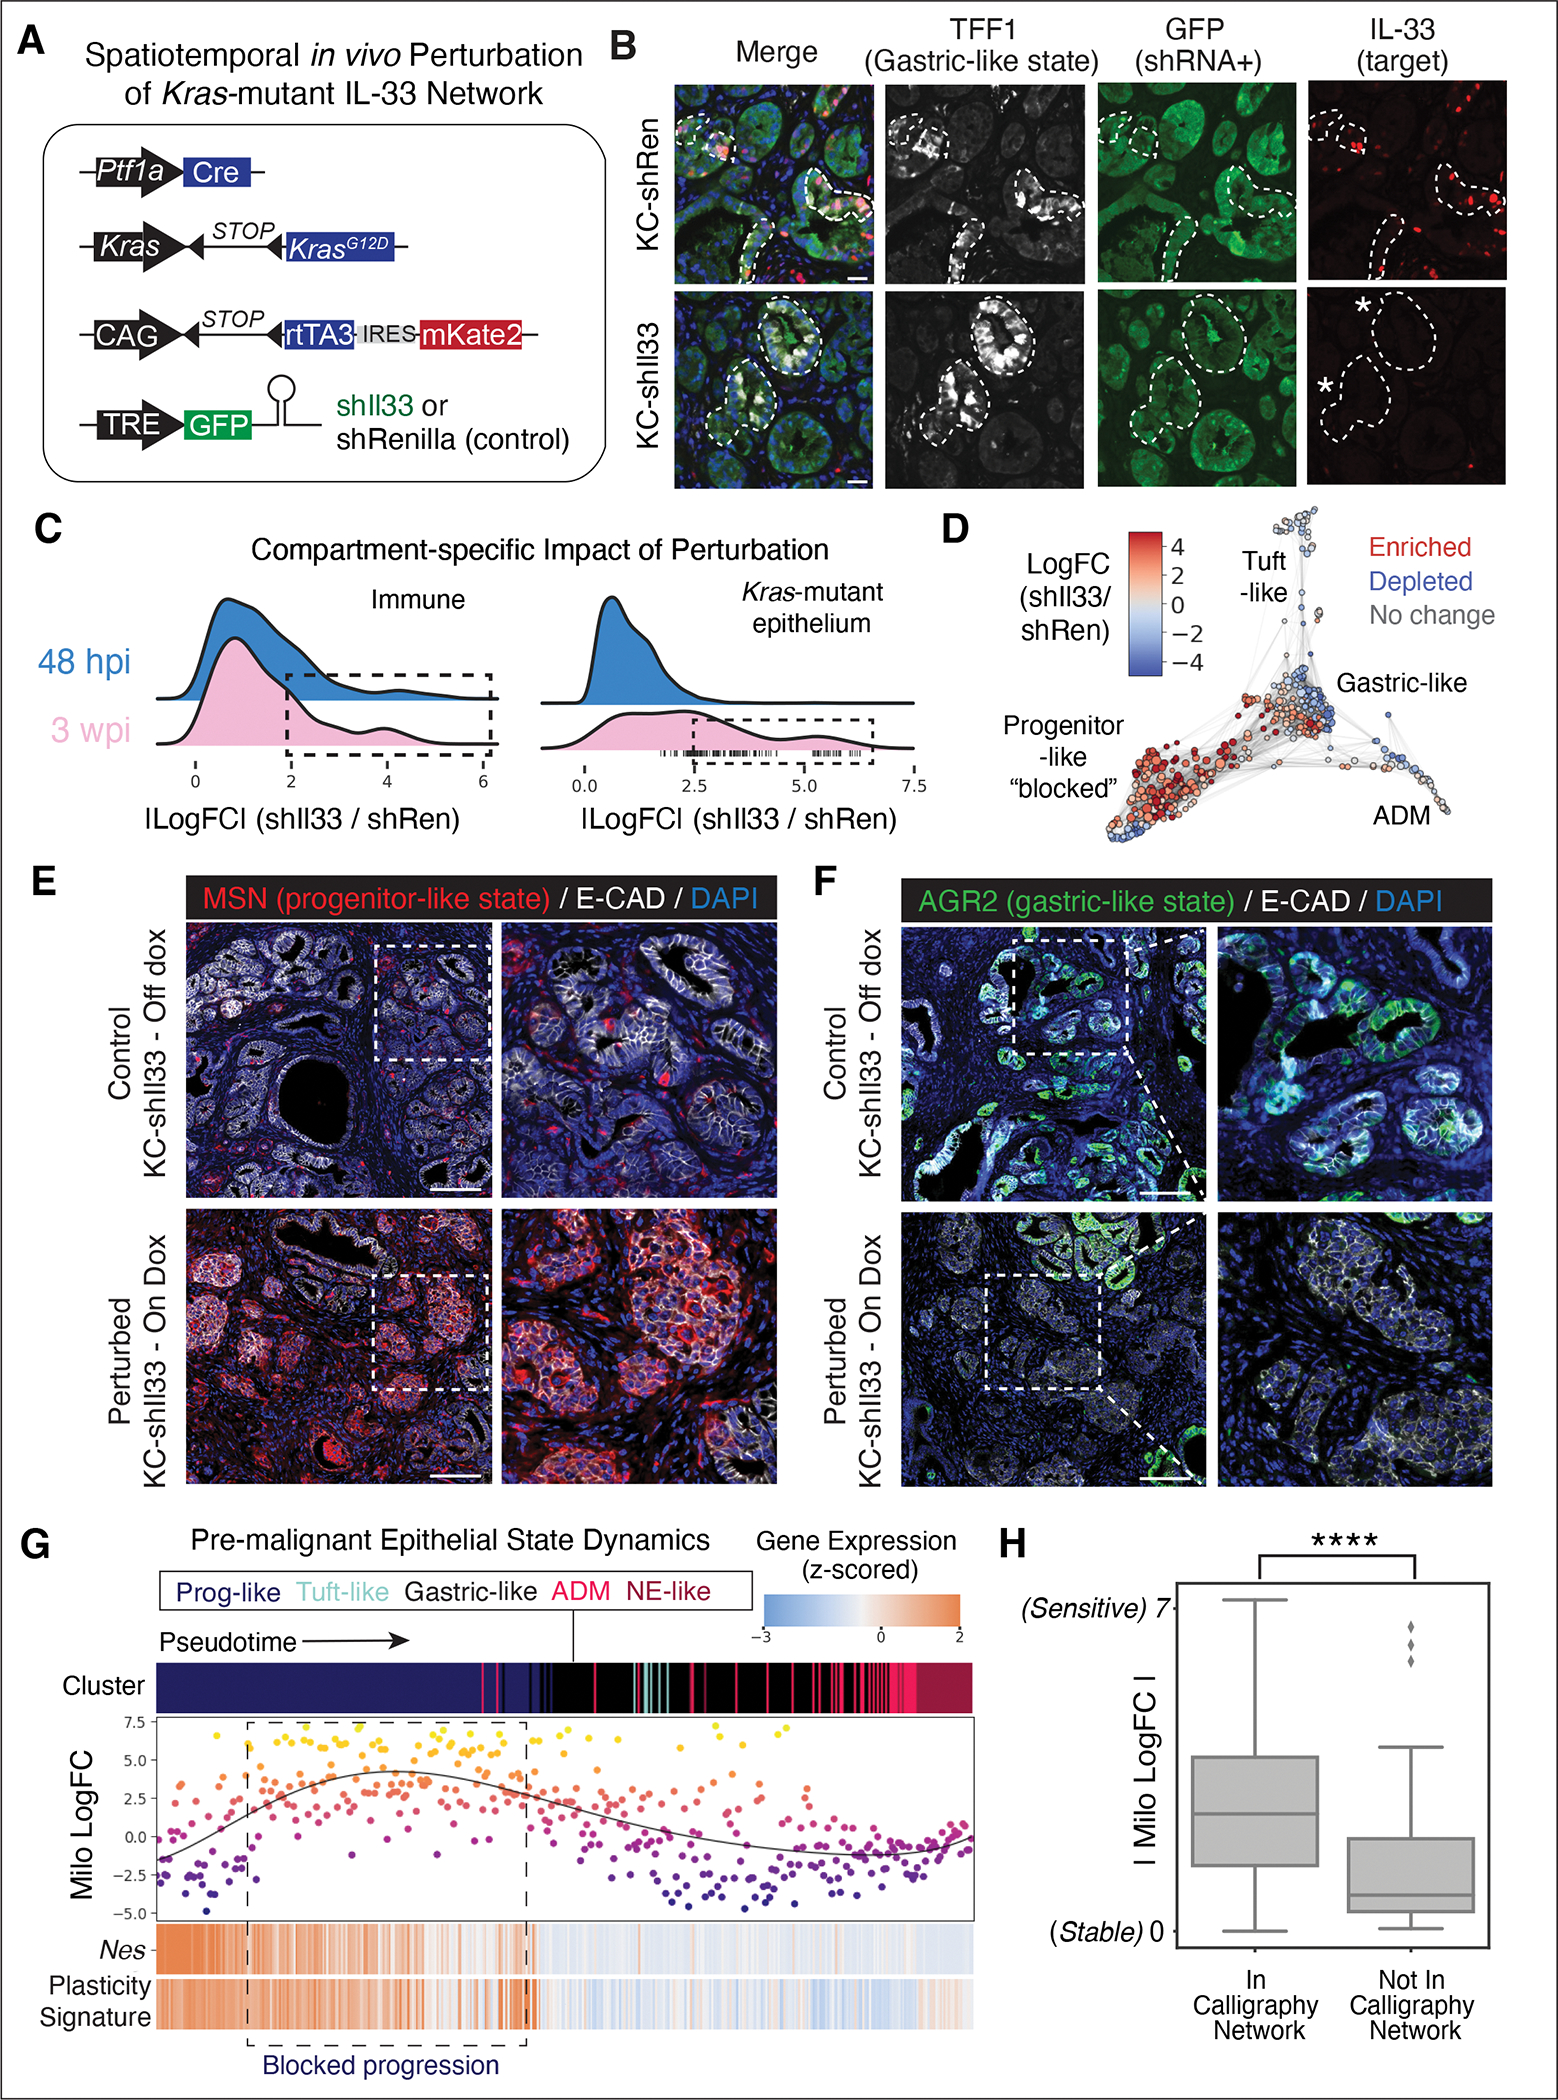
Figure 6. Spatiotemporal in vivo perturbation of Il33 impairs neoplastic progression.

(A) Mouse models for inducible repression of Il33 (KC-shIl33, 2 independent strains) or Renilla control (KC-shRen), restricted to Kras-mutant epithelial cells by Ptf1a-Cre expression. (B) Representative IF of pancreata from control (top) or KC-shIl33 (bottom) mice placed on dox at 5 weeks of age and analyzed 9 days later at the 48 hpi timepoint (K2). Kras-mutant epithelial cells, not surrounding stroma, express Il33 shRNA marked by GFP in KC-shIl33; TFF1 marks cell-state in which IL-33 is activated at 48 hpi in control but not shIl33 animals. Dashed lines demark epithelium-stroma boundary, asterisks highlight suppression of Il33 in TFF1+ metaplastic cells of KC-shIl33 mice. DAPI marks nuclei (blue). Scale bar, 20 μm. (C) Milo (60) log fold change (logFC) magnitudes across cell neighborhoods (n = 5 mice), with higher values indicating greater impact of IL-33 perturbation. Rightward distribution shifts (dotted lines) indicate a larger impact on particular cell-states; vertical dashed lines indicate neighborhoods with significant (adjusted p < 0.1) shifts according to Milo, appearing only in K3 epithelia. (D) FDL of Milo neighborhoods colored by logFC of abundance in shIl33 samples relative to controls, at the late (3 wpi) timepoint. (E,F) Representative IF in pancreata from KC-shIl33 mice placed on-dox (bottom) or off-dox (top) at 3 wpi (K3), showing (E) aberrant accumulation of progenitor-like state (MSN+) in epithelial cells (E-cadherin+) of IL-33-perturbed animals at 48 hpi and (F) depletion of gastric-like (AGR2+) states upon epithelial IL-33 suppression. DAPI marks nuclei (blue). Scale bar, 100 μm. (G) Impacts of Il33 perturbation across Kras-mutant epithelial neighborhoods at K3 (3 wpi). Top, pseudotime-ordered neighborhoods (columns) colored by cell-state. Middle, neighborhoods plotted and colored by Milo logFC; higher logFC denotes greater abundance in shIl33 relative to control. Bottom, Nes and plasticity-associated gene expression (Fig. 3F) (27); heatmap colors scaled to ±2 s.d. from mean. (H) Milo logFC of neighborhoods mapped to modules that are (left) or are not (right) downstream of Calligraphy’s IL-33-centric network; asterisks, indicate significance (unpaired, one-tailed t-test, p value = 1.24 X 10⁻⁷).
