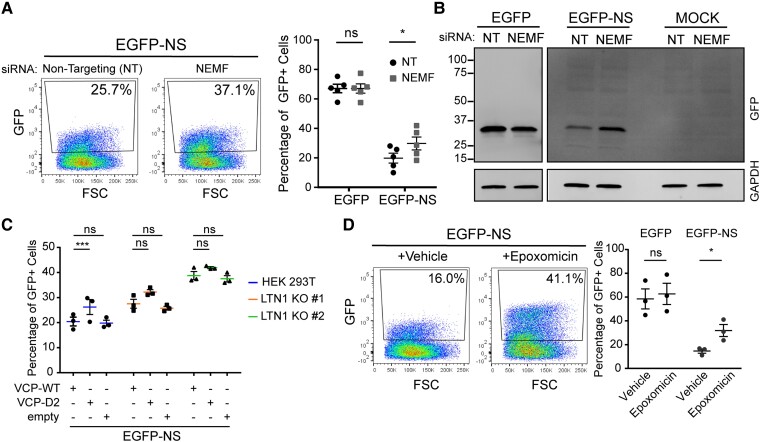
Figure 2.
RQC complex degrades non-stop mRNA protein in mammalian cells. (A) KD of NEMF in HEK 293T was done using siRNAs and EGFP-NS reporter expression was analysed using flow cytometry. Representative dot plot of GFP fluorescence in NEMF and control siRNAs cells is shown (left). Percentage of GFP-positive cells expressing GFP control or EGFP-NS reporter from five biological replicates (right). Percentage is shown as mean ± SEM with all data points (mixed effects model, n = 5, EGFP:NEMF KD P = 0.9941, NS:NEMF KD P = 0.0213). (B) Triton soluble protein fraction from cells transfected with NEMF and non-targeting siRNAs expressing either EGFP control, EGFP-NS reporter or Mock control was analysed by immunoblotting against GFP. (C) Effect of co-expression of VCP-mutant proteins in EGFP-NS reporter in parental HEK 293T and LTN1 KO cells was assessed by flow cytometry. Graph shows the percentage of GFP-positive cells as mean ± SEM with all data points (mixed effects model, n = 3, parental:D2 P = 0.0039, parental:empty P = 0.7173, LTN1 KO #1:D2 P = 0.6569, LTN1 KO #1:empty P = 0.6473, LTN1 KO #2:D2 P = 0.2946, LTN1 KO #1:empty P = 0.7977). (D) Proteasome activity was inhibited by treating the cells with 2 µM epoxomicin or vehicle and percentage of GFP-positive cells was quantified by flow cytometry 6 h after treatment. Data are shown as mean ± SEM with all data points and expanded in Supplementary Fig. 2B (mixed effects model, n = 3, EGFP:Epo P = 0.2468, NS:Epo P = 0.0176).

