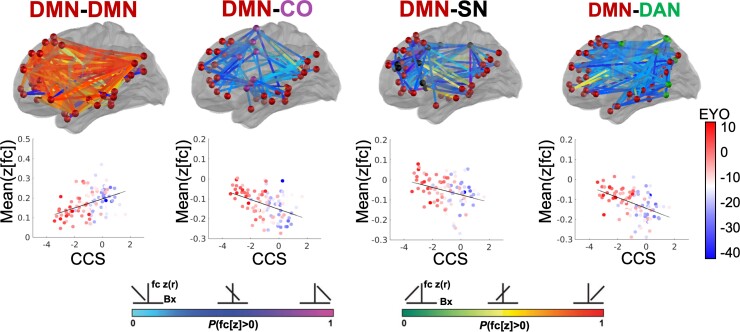
Figure 5.
Network FC associated with NfL is correlated with cognitive function in MC. Orange-red lines indicate a positive correlation between DMN within network FC and CCS, wherein individuals with the lowest CCS have the lowest DMN FC. Blue lines indicate a negative correlation between DMN FC with control networks and CCS, wherein individuals with the worse cognitive function have reduced anti-correlation between DMN and SN, DAN, and CO networks.

