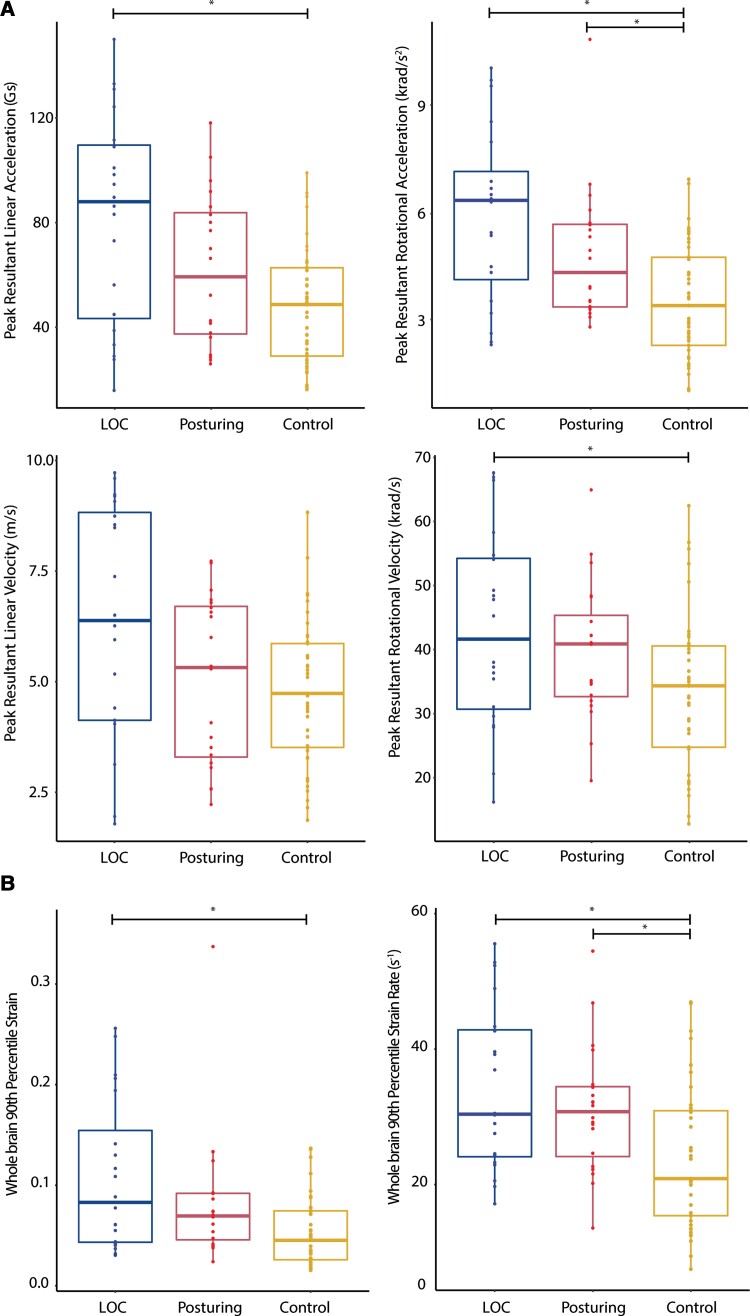
Figure 3.
Kinematics and biomechanics of impacts. (A) Plots of rotational and linear acceleration and velocity; (B) Strain and strain rates for impacts leading to LOC (left), posturing (middle) or no visible signs (control, right). Format of box plots as in Fig. 2. Horizontal bars and asterisks highlight where groups are significantly different after post hoc testing (P < 0.05).

