Figure 5.
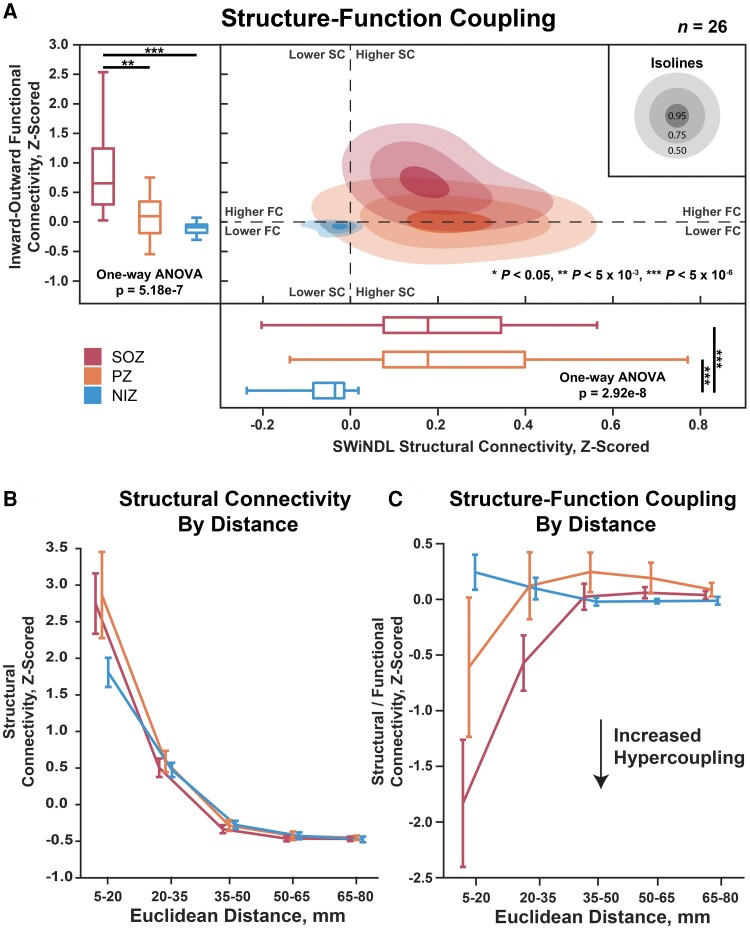
Structure–function coupling over Euclidean distance. (A) The left boxplots show the functional connectivity (PDC inwards strength minus outwards strength) of SOZ, PZ and NIZ. The bottom boxplots show structural connectivity as measured by SWiNDL. The contours in the middle show the 2D distribution of the scatterplot of functional versus structural connectivity. (B) Structural connectivity over Euclidean edge distance. Error bars represent 95% confidence intervals. Repeated measures two-way ANOVA: SOZ/PZ/NIZ effect P = 7.52 × 10⁻³, distance effect P = 1.75 × 10−64, interaction effect P = 5.44 × 10⁻⁹. (C) Structural–functional connectivity over Euclidean edge distance. Repeated measures two-way ANOVA: SOZ/PZ/NIZ effect P = 7.27 × 10⁻⁴, distance effect P = 8.63 × 10⁻¹⁹, interaction effect P = 9.76 × 10⁻²¹. Post-ANOVA multiple comparison: **P < 5 × 10⁻³, ***P < 5 × 10⁻⁶. n = 26 patients.

