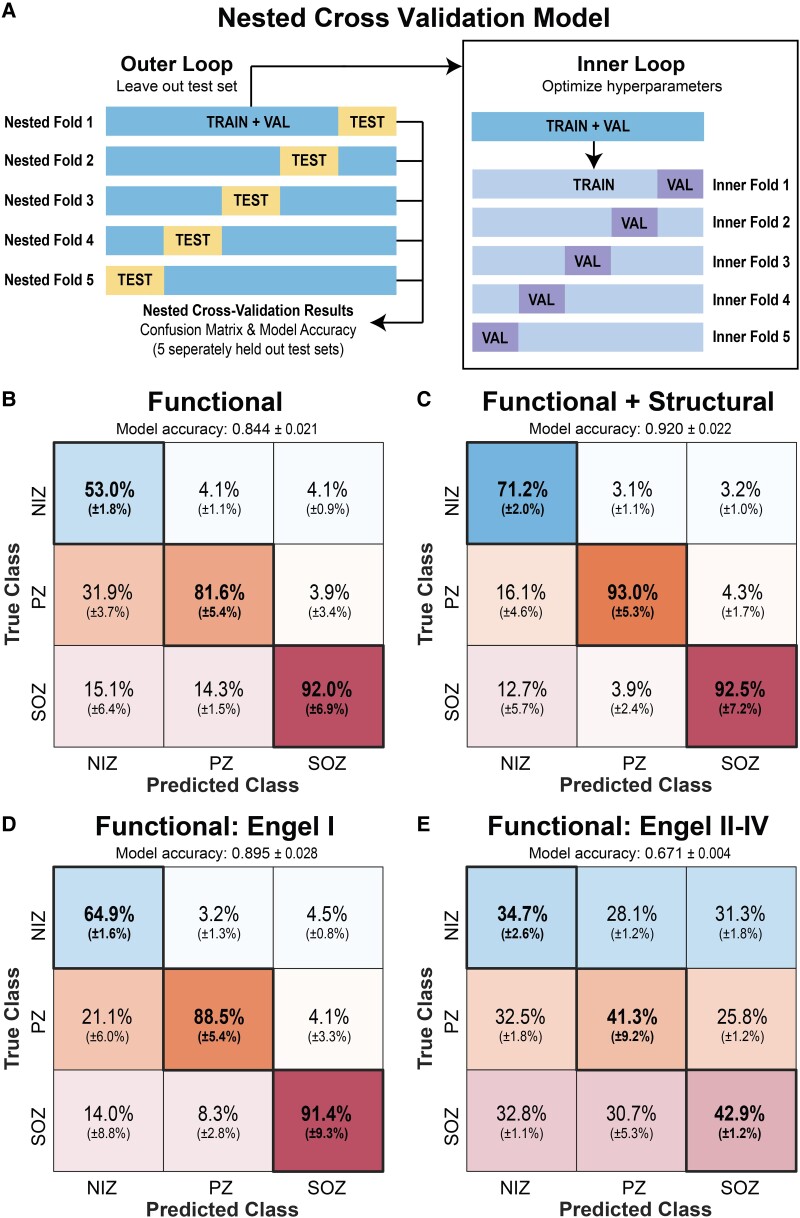
Figure 7.
Classification of SOZ, PZ and NIZs using an SVM. (A) A 5-fold nested cross-validation scheme was used to evaluate the SVM’s ability to classify SOZ versus PZ versus NIZ. A completely withheld testing set delineated at the patient level was used for each model evaluation. (B) Confusion matrix when only functional connectivity was used to generate the model. Overall held-out test set accuracy of 84.4 ± 2.1% (mean ± SD). Confusion matrix percentages are normalized by column—i.e. each confusion matrix entry can be interpreted as ‘If the model predicts this SEEG contact is a [SOZ/PZ/NIZ], then there is an X% chance it truly is’. (C) Confusion matrix for a model using functional and structural connectivity with overall held-out test set accuracy of 0.920 ± 2.2%. (D) Confusion matrix for a model generated with only Engel I subjects with overall held-out test set accuracy of 89.5 ± 2.8% (E) Confusion matrix for Engel II–IV subjects tested with the model generated from Engel I subjects (i.e. model ‘D’) with overall held-out test set accuracy of 67.1 ± 0.4%.

