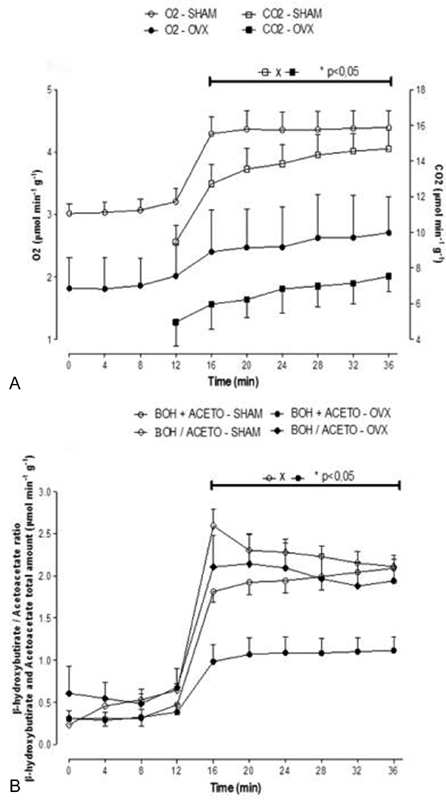
Fig. 3.

Time course of the changes in metabolic flux due to oxidation of octanoate in perfused livers from fasted mice. 0.3 mM octanoate, [1-14C]octanoate (0.01 μCi/ml) plus 50 μM fatty acid-free bovine serum albumin were infused at 12–36 min of perfusion. Oxygen uptake and 14CO2 production (panel A) and β-hydroxybutyrate and acetoacetate production (panel B) are reduced in the ovariectomized group (n = 4) compared with SHAM group (n = 4). Vertical bars represent mean standard errors. Asterisks indicate significant differences between the values as revealed by variance analysis with post hoc Newman-Keuls testing (p < 0.05).
