Fig. 1.

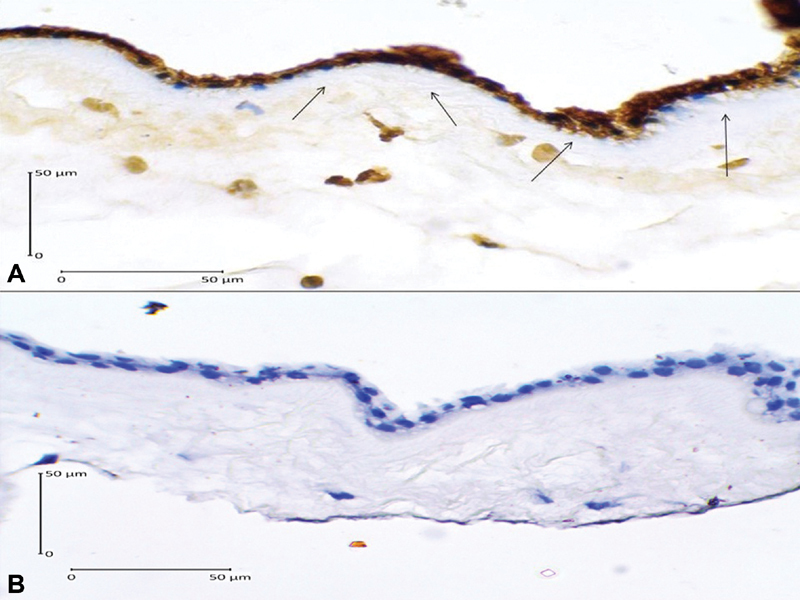
Caspase-3 expression in the amniotic epithelial cells (400x magnification). (A) Positive expression shown by dark brown cytoplasm staining with blue nucleus (arrows); (B) Negative expression shown by clear cytoplasm with bright blue nucleus.

Caspase-3 expression in the amniotic epithelial cells (400x magnification). (A) Positive expression shown by dark brown cytoplasm staining with blue nucleus (arrows); (B) Negative expression shown by clear cytoplasm with bright blue nucleus.