
Figure 1: Non-vascular ADAR1 contributed to AAA formation.
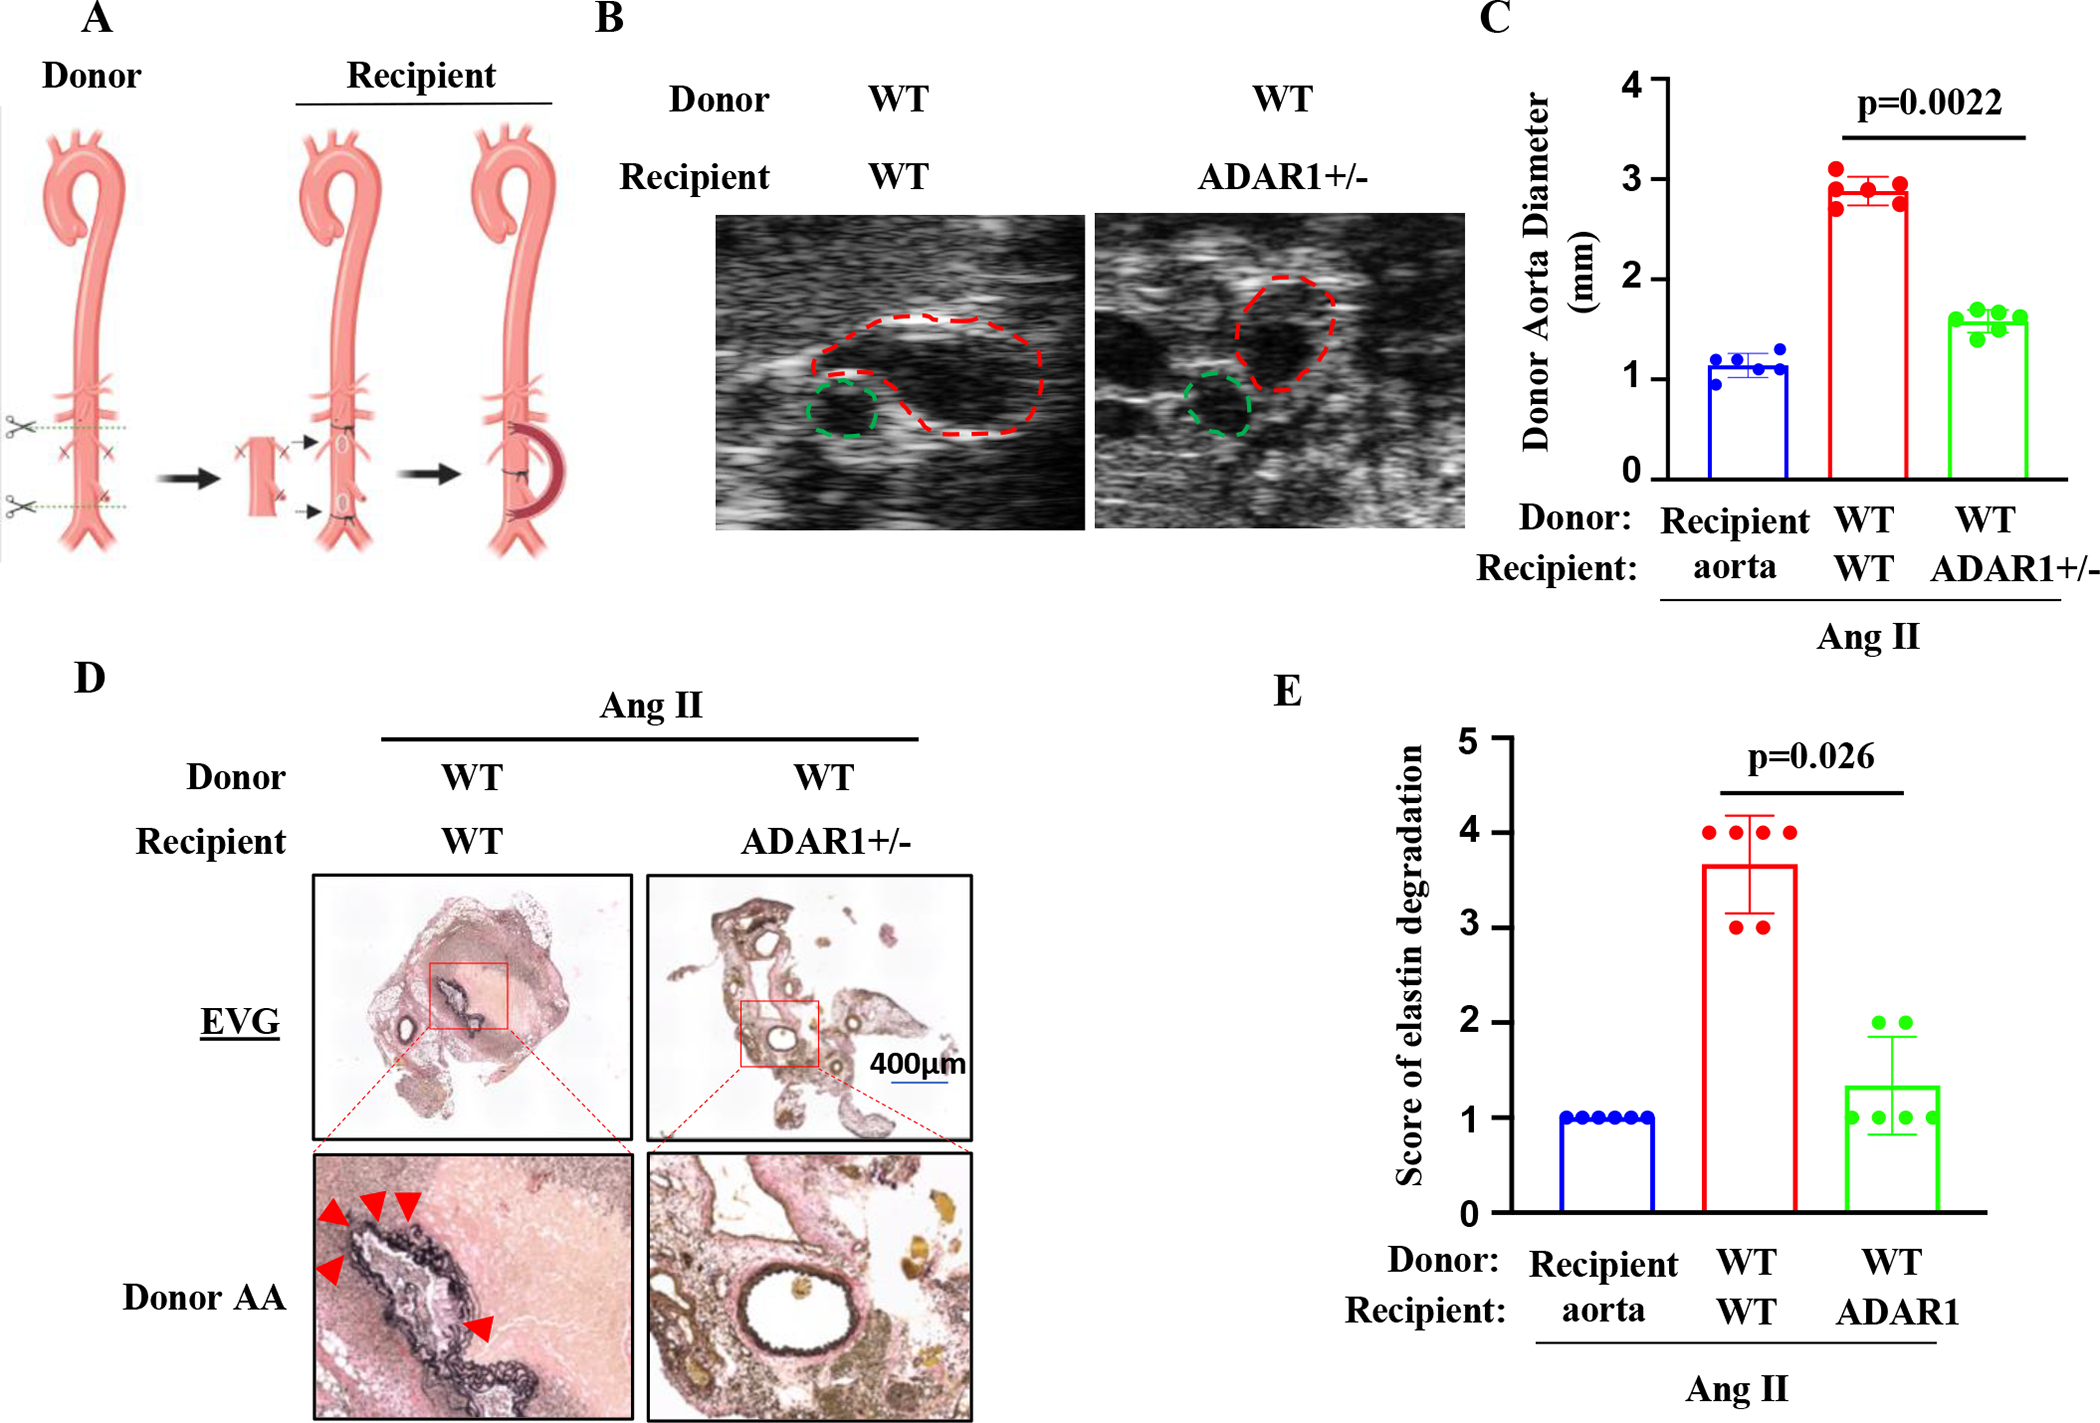
A, A graphic illustration of the mouse aortic transplant. Donor aortic segment was anastomosed to the recipient abdominal aorta in an end-to-side manner. The recipient aorta was ligated to diverge the blood flow through the donor aorta. Recipient mice were then infused with Ang II (1000 ng/kg/min) for 28 days. B, Representative transverse ultrasound images of abdominal aorta 28 days after the Ang II infusion. Red dash circles: donor aortas; Green dash circles: recipient’s own aortas. C, Maximal external diameters of donor aortas were measured by ultrasound imaging. P=0.0022, wild-type (WT) aortas to ADAR+/− vs. to WT recipients, n=6. D Representative images of Verhoeff’s elastic (EVG) staining of the transplanted aortas with aneurysm. The areas in the red boxes were shown with a higher magnification (4.2 folds) in the lower part of the panel. Arrows indicate elastin breaks. E: Quantification of elastin breaks in the donor aortas of Ang II-infused WT and ADAR1+/− recipient mice. P = 0.026, wild-type (WT) donor aortas to ADAR+/− vs. to WT recipients, n=6. Kruskal-Wallis test with Dunn multiple comparisons test was performed for C and E.