
Figure 8. Human IMA was anastomosed to recipient abdominal aorta in an end-to-end manner in NSG mice.
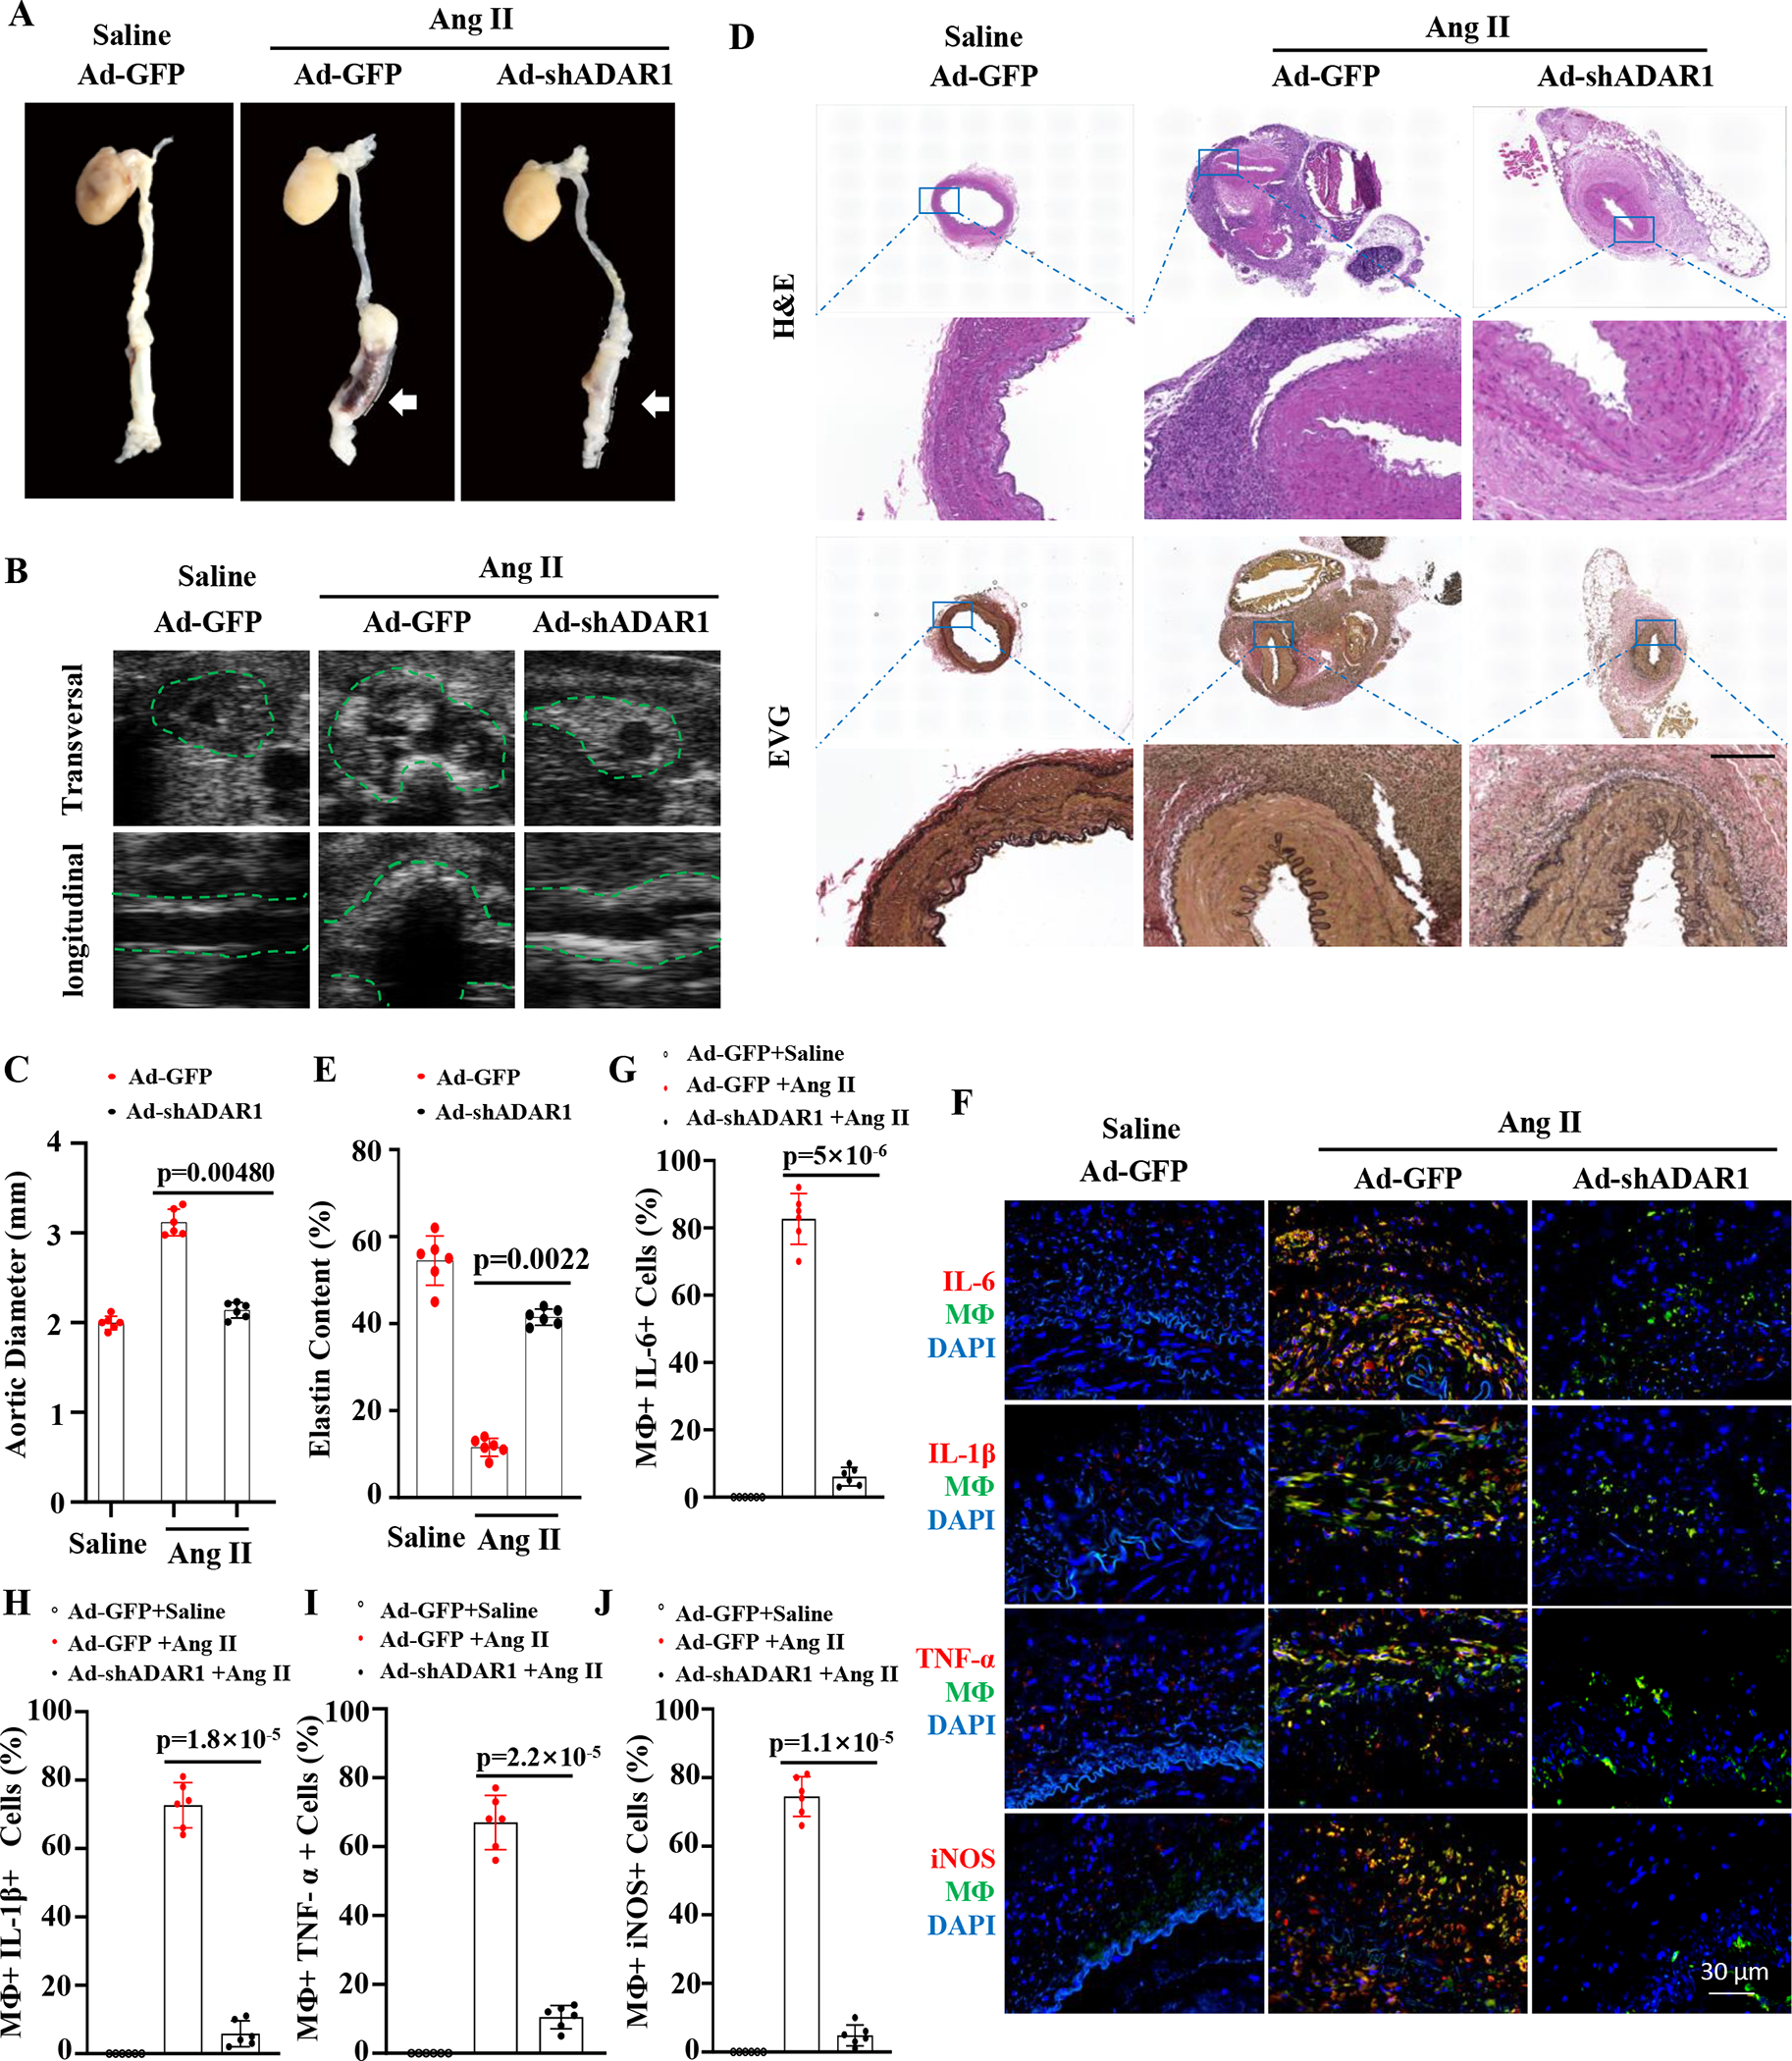
Monocyte stained with green dye were injected (I.V.) the first day after the transplantation and then once every 7 days thereafter. Two weeks after the transplantation, recipient mice were infused with Ang II (1000 ng/kg/min) for 28 days. A, Representative aneurysm formation as marked by white arrows. B, ADAR1 deficiency in monocytes diminished Ang II-infusion-caused aorta dilation in NSG mice as imaged by B mode ultrasound longitudinally and transversely. Green dash lines outline transplanted human IMA. C, Quantitative analyses of maximal external aortic diameters. D, Representative images of hematoxylin and eosin (H&E) or Verhoeff elastic (EVG) staining of AAA tissues. Scale bar=400 μm. E, Quantification of elastin contents shown in the EVG staining in aorta in D. F, Mice with human IMA transplants were infused with angiotensin II (Ang II, 1000ng/kg/min) for 7 days. Abdominal aorta frozen sections were immunostained (red) with IL-6, IL-1β, TNFα, or iNOS antibodies. Yellow indicates the colocalization of the cytokines with human monocytes/macrophages. G-J: The percentage of macrophages expressing IL6 (G), IL-1β (H), IL-6 (I) or iNOS (J) relative to the total macrophages were quantified for each grafted IMA. p=0.0048 (C), 0.0022 (E), 5×10⁻⁶ (G), 1.8×10⁻⁵ (H), 2.2×10⁻⁵ (I), and 1.1×10⁻⁵ (J), Recipient mice with ADAR1 shRNA adenoviral vector (Ad-shADAR1)-transduced monocytes vs. with Ad-GFP-transduced monocytes and Ang II infusion n=6. Mann-Whitney test (2-sided) was performed for E. Kruskal-Wallis test with Dunn multiple comparisons test was performed for C, G, H, I, and J.