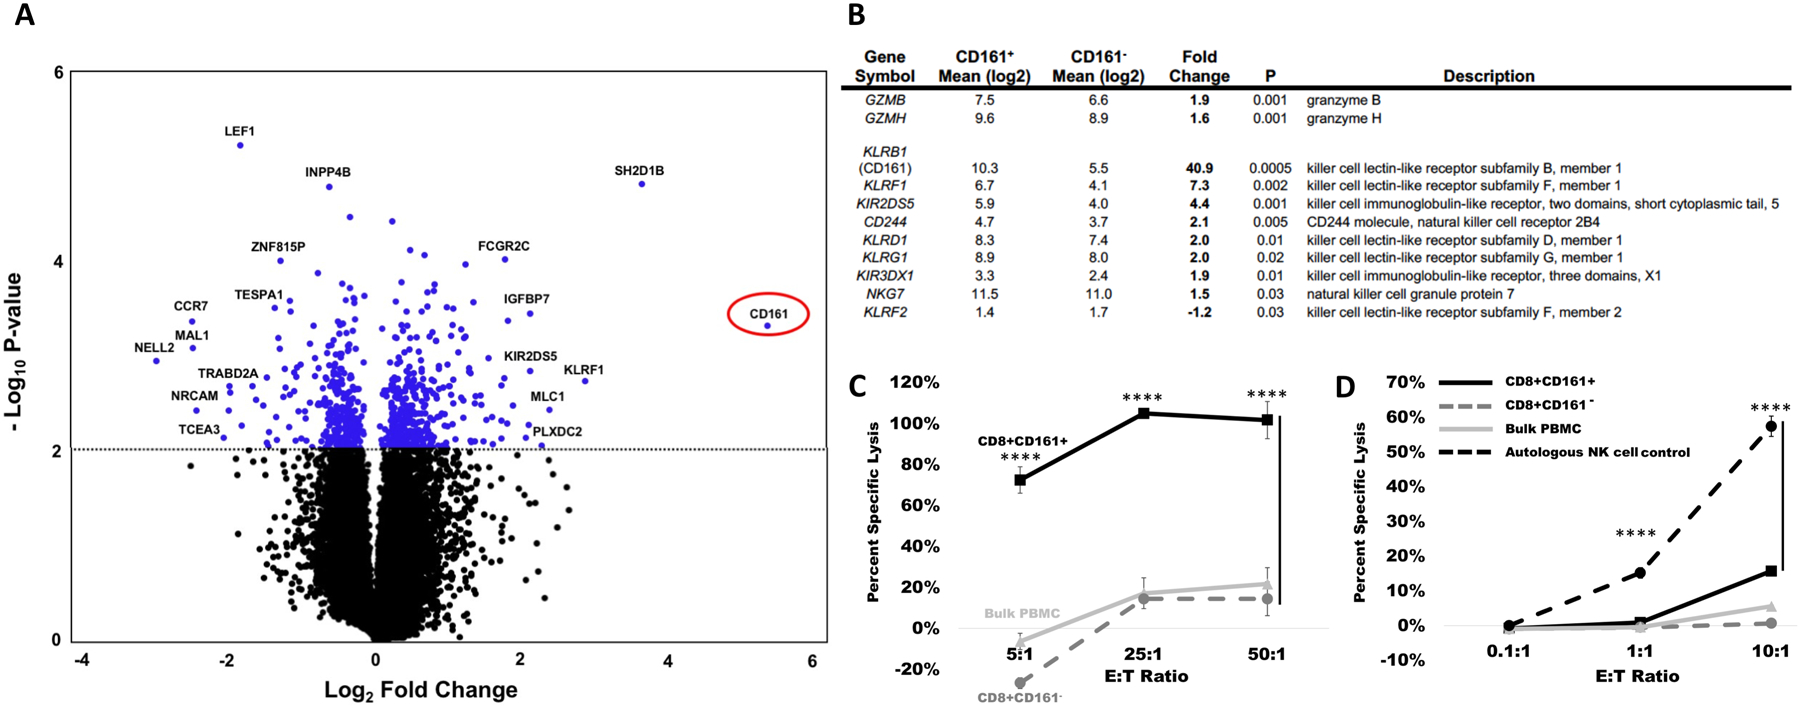
Figure 3. The murine CD3+ CD8+ NK1.1+ cell population is phenotypically similar to the human CD3+ CD8+ CD161+ cell population.

CD3+ CD8+ CD161+ and CD3+ CD8+ CD161− cells, the equivalent human population to the murine CD3+ CD8+ NK1.1+ cells and CD3+ CD8+ NK1.1− cells were magnetically sorted and evaluated by microarray. (A) A volcano plot is shown comparing the differential regulation of genes between CD8+ CD161+ and CD8+ CD161− cells, with the gene encoding CD161 circled in red. (B) The CD8+ CD161+ cell population exhibits elevated expression of granzymes and killer lectin like receptor genes. (C and D) Fresh buffy coat products were divided into bulk PBMC, CD8+CD161+, and CD8+CD161− fractions and tested in 51Cr killing assays against HEK293 allogeneic cell targets (C) or K562 targets (D). For each target, lysis was performed at the E:T ratio indicated on the X-axis. For all lysis assays, data are presented as mean ± standard deviation, ****p < 0.0001 by one-way ANOVA with Tukey’s post-hoc analysis.
