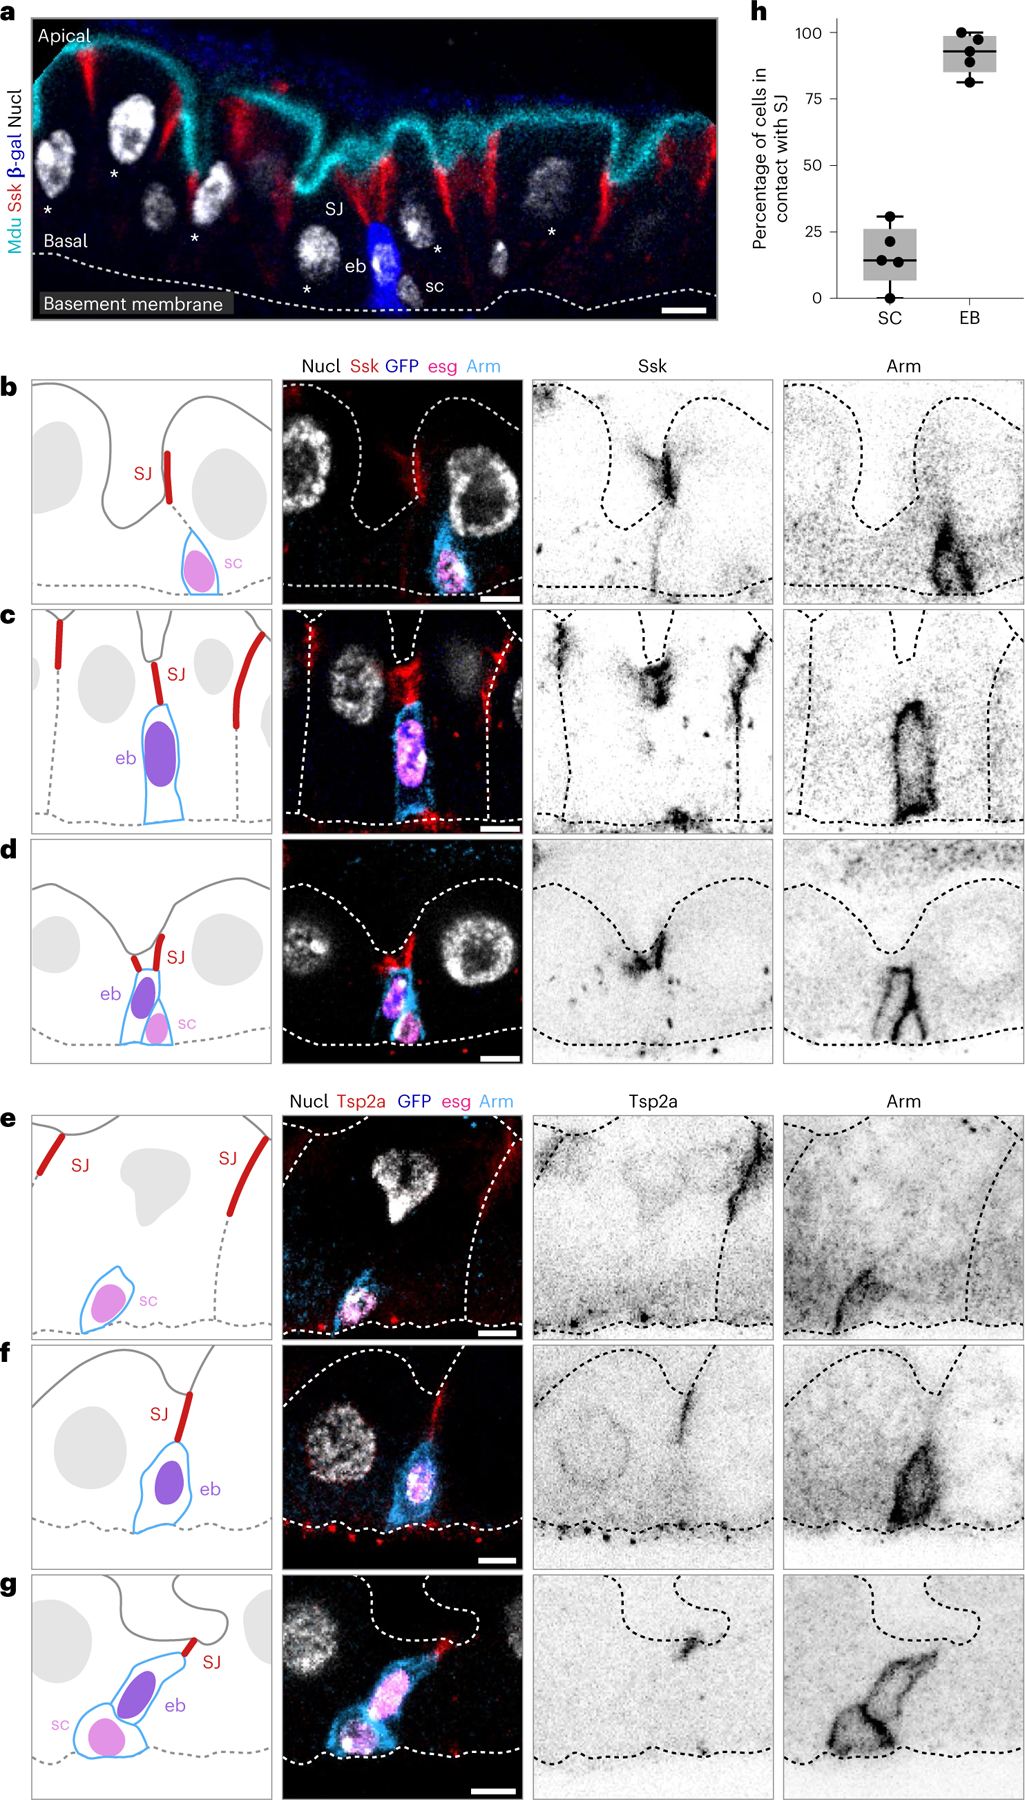
Fig. 1 |. The apex of a differentiating enteroblast contacts the SJ of its neighbour enterocytes.

a, Architecture and stem cell lineage of the fly midgut epithelium, shown in cross-sectional view. Apical lumenal brush border (cyan, Mdu::GFP; Extended Data Fig. 4) at top; basal surface (dotted line, basement membrane) at bottom. The gut’s absorptive lineage is shown: (1) stem cells (sc) are basally localized, diploid cells that do not express Su(H)-lacZ. (2) Enteroblasts (eb) are terminally committed progeny transitioning from stem-like cells to enterocytes; eb express Su(H)-lacZ (blue, β-gal). (3) Mature enterocytes (asterisks) are large, polyploid cells that have turned off Su(H)-lacZ expression. SJs (red, Snakeskin) appear at the apico-lateral borders of enterocytes. b–g, Stem cells do not overlap with SJs, while the apex of enteroblasts contacts the basal termini of enterocyte–enterocyte SJs. Cartoons (left column) and immunofluorescent images of esg-GAL4, UAS-his2b::CFP; Su(H)-GFP:nls midguts immunostained for SJ components Ssk (red, b–d) or Tsp2a (red, e–g) and for the stem cell/enteroblast marker Arm (green; cortical). esg-driven His2b::CFP (magenta), Su(H)-driven GFP:nls (blue) and nuclei (DAPI; greyscale). Lumenal epithelial surface and basement membrane are indicated by dotted lines. Stem cells (sc) are His::CFP+, Arm+, GFP:nls− cells in b, d, e and g; enteroblasts (eb) are His::CFP+, Arm+, GFP:nls+ cells in c, d, f and g. d and g show stem cell–enteroblast pairs. b–g are representative images collected from five guts in two independent experiments. Images are projections of short confocal stacks. Scale bars, 5 μm. Full genotypes are in Supplementary Table 1. h, Quantitation of b–g. Most enteroblasts (92.1 ± 7.4%) but few stem cells (16.0 ± 11.3%) contact the SJ network. Each point represents one gut. Box plot displays median as centre line, the bounds of the box represent the first and third quartiles, and the whiskers show the minimum and maximum values (N = 5 guts; n = 119 stem cells, n = 125 enteroblasts).
