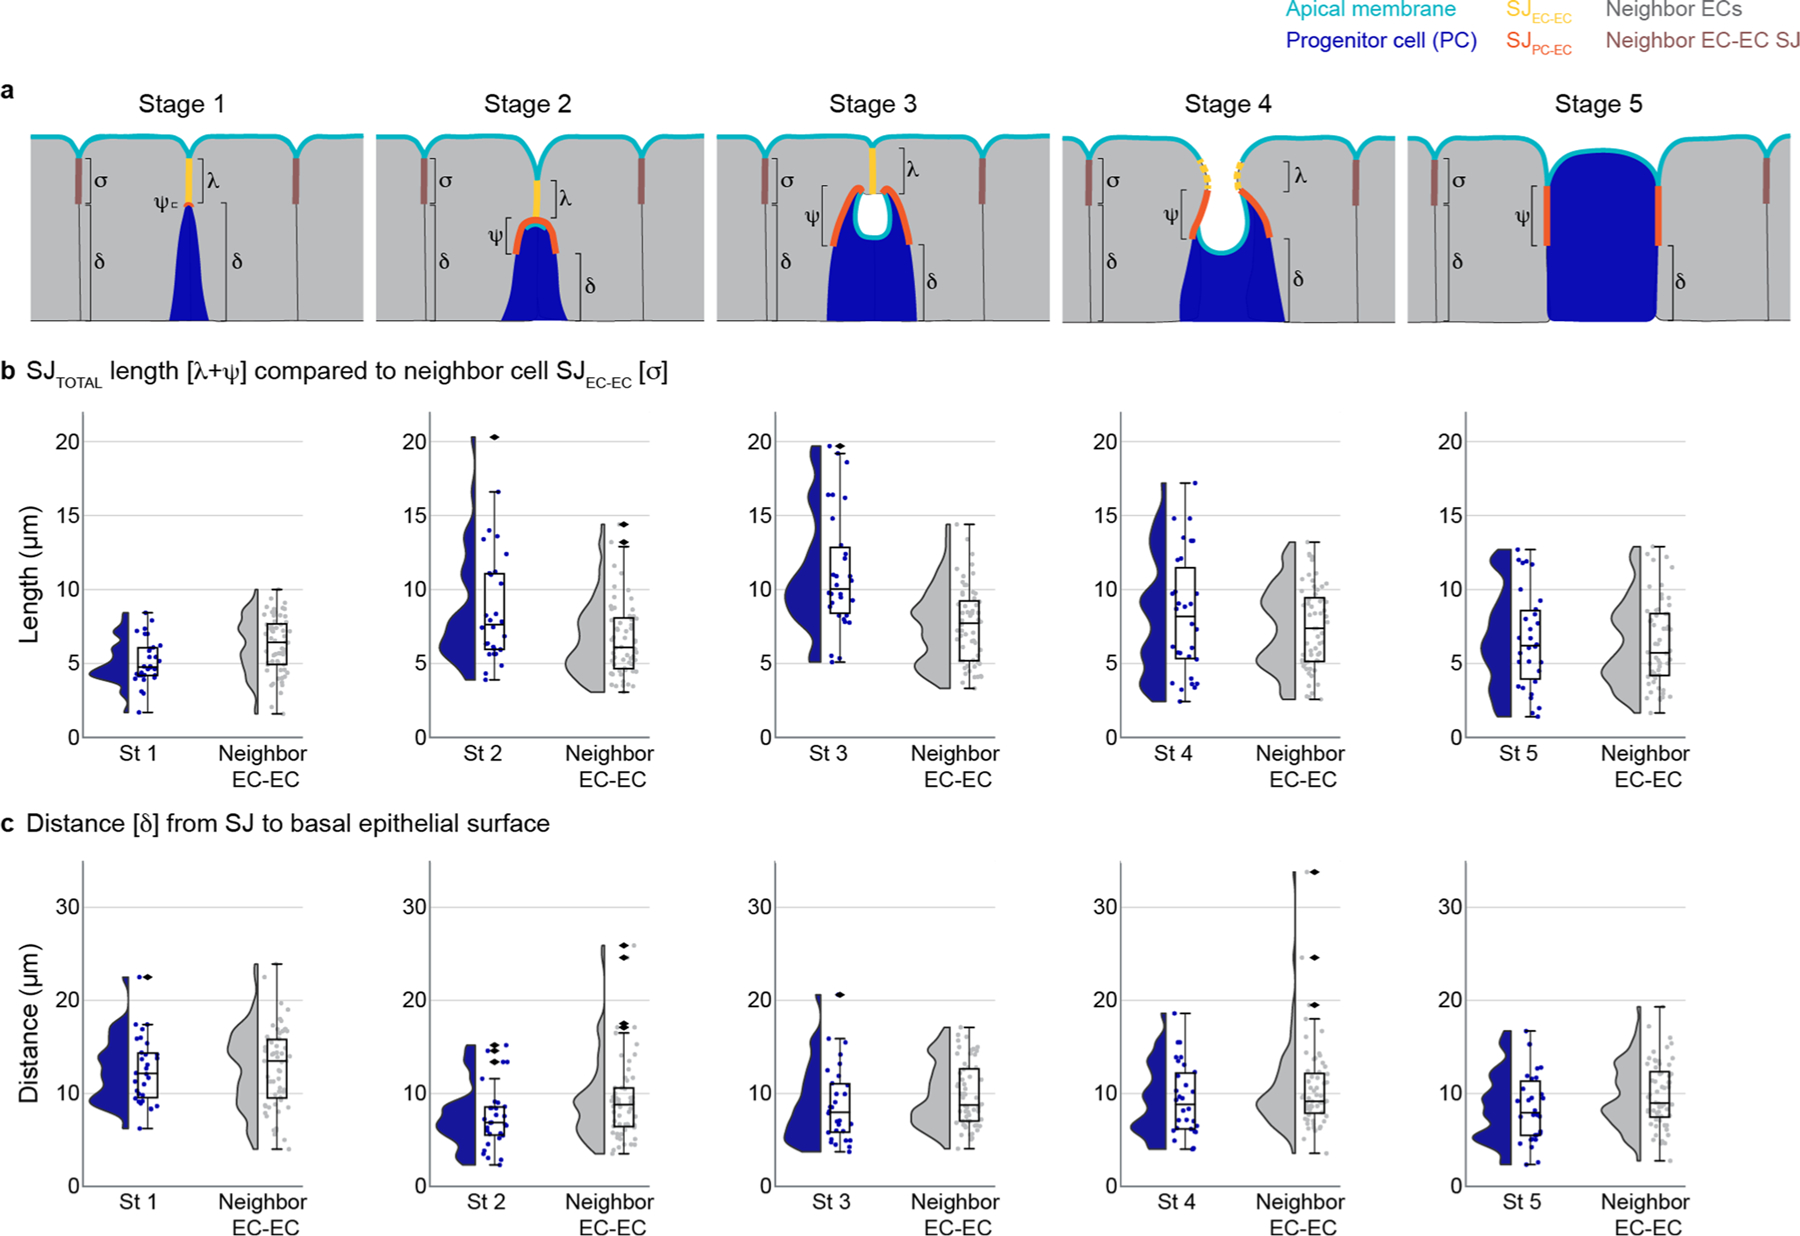
Extended Data Fig. 5 |. PAC integration affects neighboring enterocyte-enterocyte SJ dynamics.

Volumetric images were analyzed from midguts that expressed Su(H)-lacZ and an apical marker (moeABD::GFP or mdu::GFP) and that were immunostained for β-galactosidase and an SJ marker (Ssk or Tsp2a). Full genotypes in Supplementary Table 1. a, Cartoon of the SJ parameters measured at each integration stage for progenitor-associated SJ: λ - SJEC-EC length, ψ - SJPC-EC length, and δ - distance from the basal edge of the SJ to the basal epithelium; and parameters measured for neighbor EC-EC SJ: σ - SJEC-EC length, and δ - distance from the basal edge of the SJ to the basal epithelium. Apical membrane, cyan; progenitor SJEC-EC, yellow; progenitor SJPC-EC, orange; progenitor cell (Su(H)-lacZ+ enteroblast or pre-enterocyte), blue; mature neighbor enterocytes, gray; neighbor SJEC-EC, brown. See Methods for measurement details. In Stage 4 depiction, dashed yellow line represents SJEC-EC that is out-of-plane of the drawing. b-c, Raincloud plots (violin plot on left; boxplot on right) show the indicated measurements for SJs associated with Stage 1–5 progenitor cells (blue; n=30 SJs for each stage) and the SJs associated with neighboring enterocytes (gray; n=60 SJs for each stage, two per each integrating progenitor). (b), Total length of SJ associated with progenitor cell (λ + ψ) compared to length of SJ between neighbor EC-EC (σ). (c), Distance from basal edge of the SJ to the basal epithelium (δ). Boxplots display median as center line, the bounds of the box represent the first and third quartiles, minimum and maximum values shown by whiskers, diamonds indicate outliers. (N=7 guts; n=150 progenitor cells).
