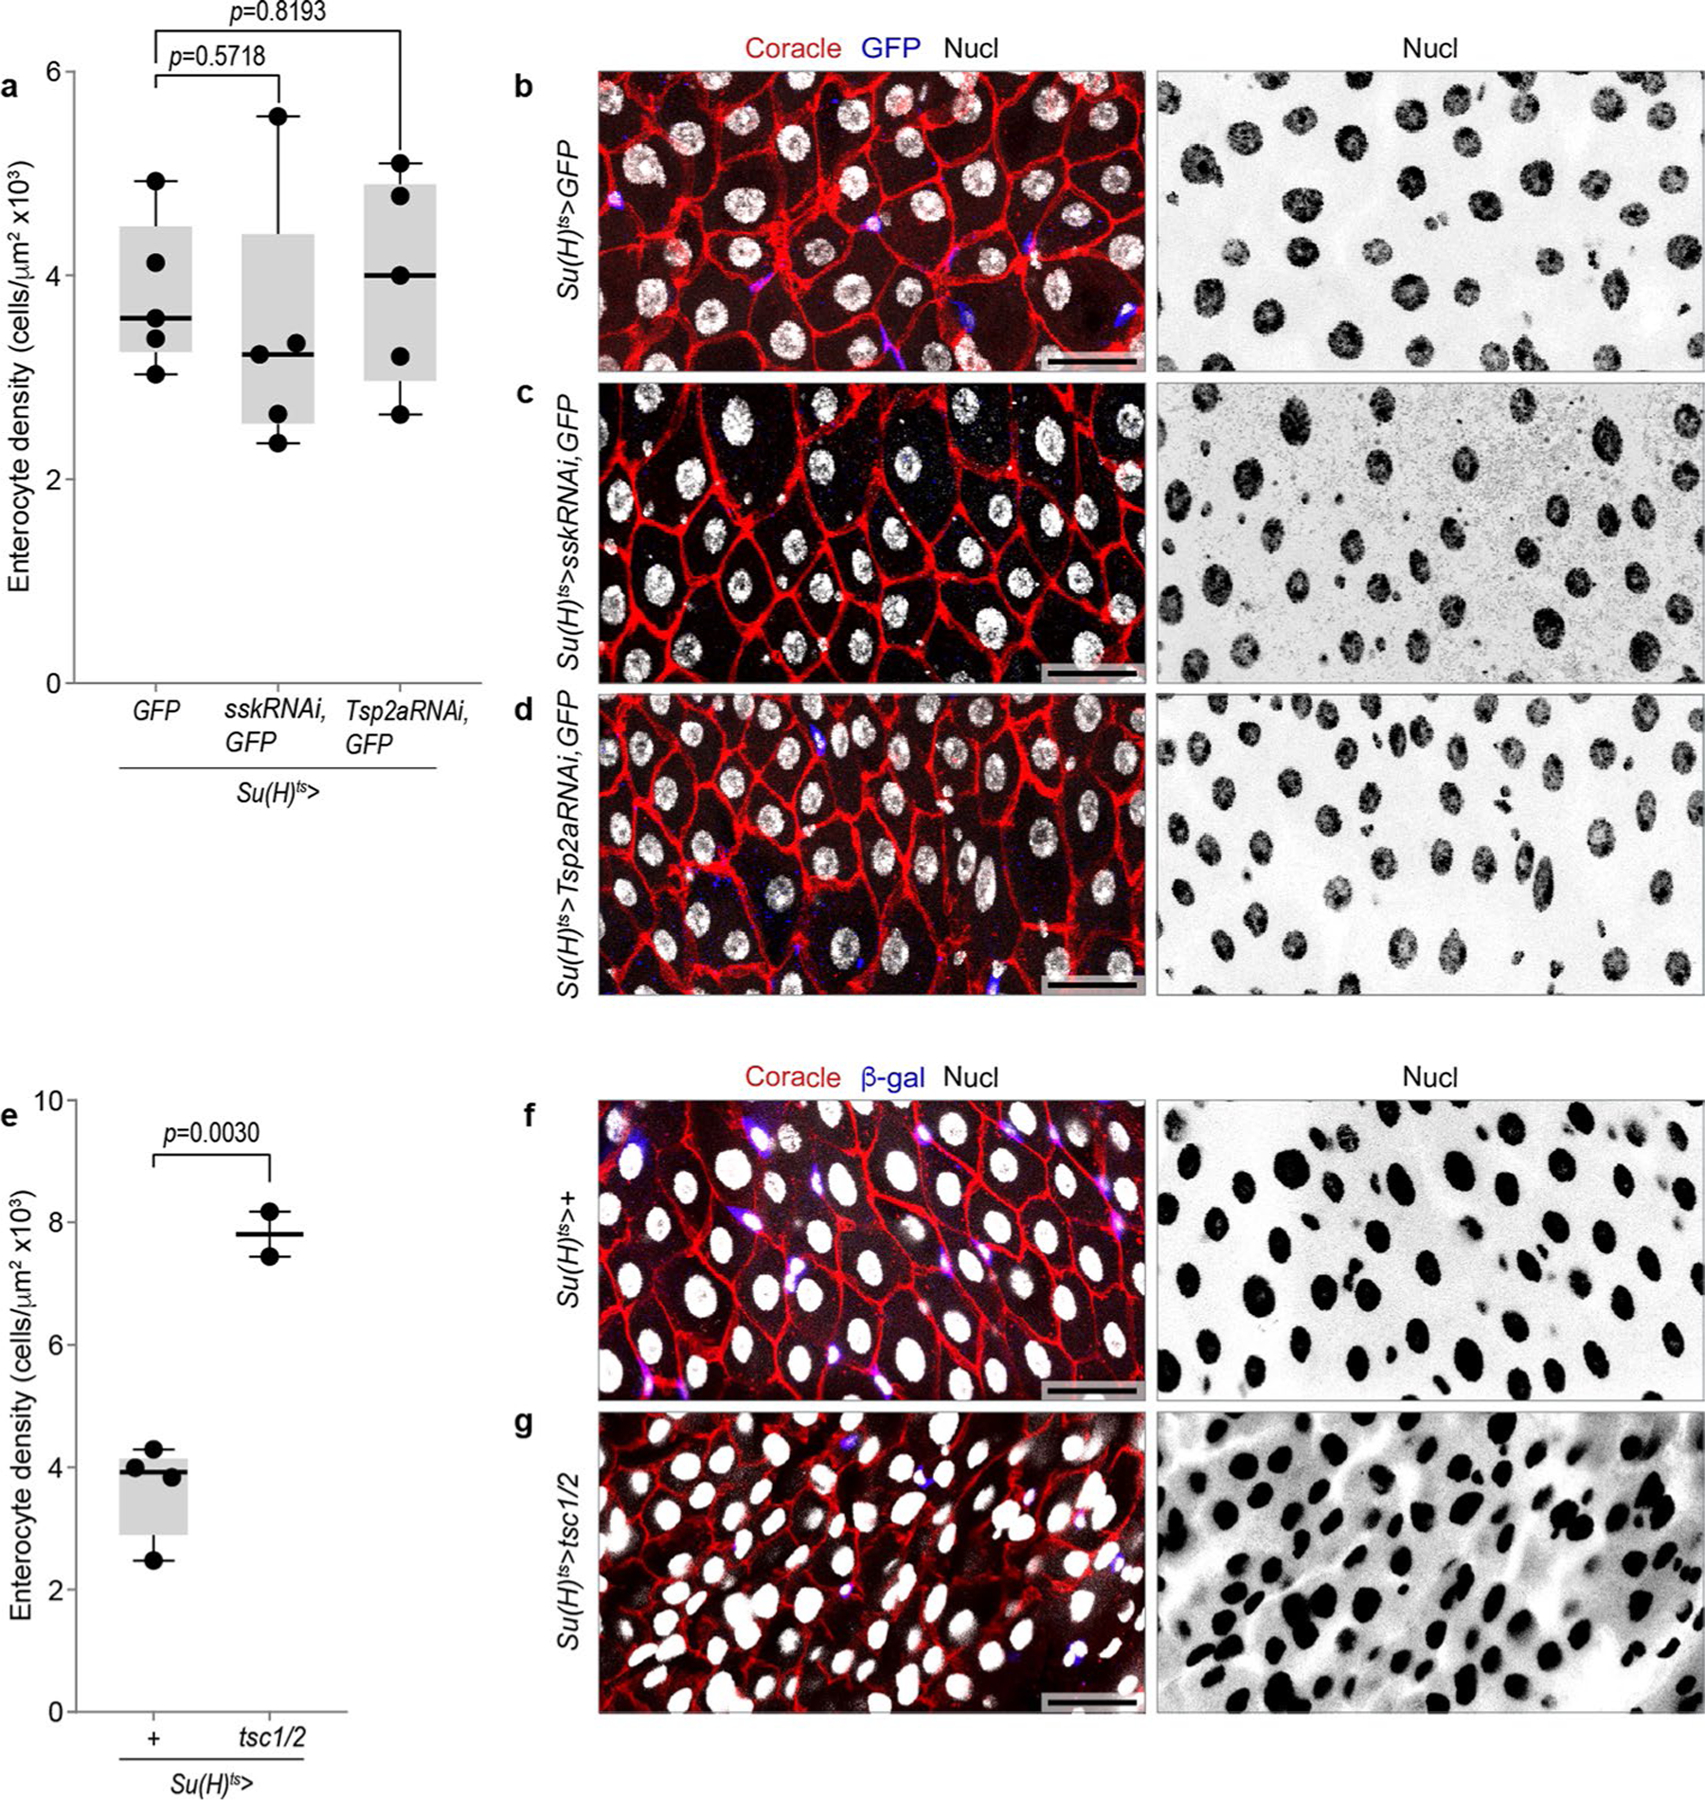
Extended Data Fig. 7 |. EC density is unaffected by SJ knockdown but increases following growth inhibition.

a-d, Knockdown of SJ components in enteroblasts does not affect enterocyte density. (a) Boxplot shows the enterocyte density in R4 region of midguts (N=5 guts per genotype). Boxplots display median as center line, the bounds of the box represent the first and third quartiles, minimum and maximum values shown by whiskers. Each data point represents one midgut. Su(H)ts>GFP versus Su(H)ts>sskRNAi (two-tailed Student’s t-test, p=0.8193), Su(H)ts>GFP versus Su(H)ts>Tsp2aRNAi (two-tailed Student’s t-test, p=0.5718). (b-d), Representative immunofluorescent images of gut epithelia from (a) Su(H)ts>GFP, (b) Su(H)ts>sskRNAi, GFP, and (c) Su(H)ts>Tsp2aRNAi, GFP. Guts immunostained for GFP (blue), the SJ marker Coracle (red), and nuclei (DAPI, grayscale). e-g, Growth inhibition in enteroblasts increases enterocyte density. (e) Boxplot shows the enterocyte density in R4 region of midguts (Su(H)ts>+, N=4 guts; Su(H)ts>tsc1/2, N=2 guts). Boxplots display median as center line, the bounds of the box represent the first and third quartiles, minimum and maximum values shown by whiskers. Each data point represents one midgut. Su(H)ts>+ versus Su(H)ts>tsc1/2 (two-tailed Student’s t-test, p=0.0030). (f,g), Representative immunofluorescent images of gut epithelia from (f) Su(H)ts>+ and (g) Su(H)ts>tsc1/2. Guts immunostained for GFP (blue), the SJ marker Coracle (red), and nuclei (DAPI, grayscale). Scale bars, 25 μm. Full genotypes are in Supplementary Table 1.
