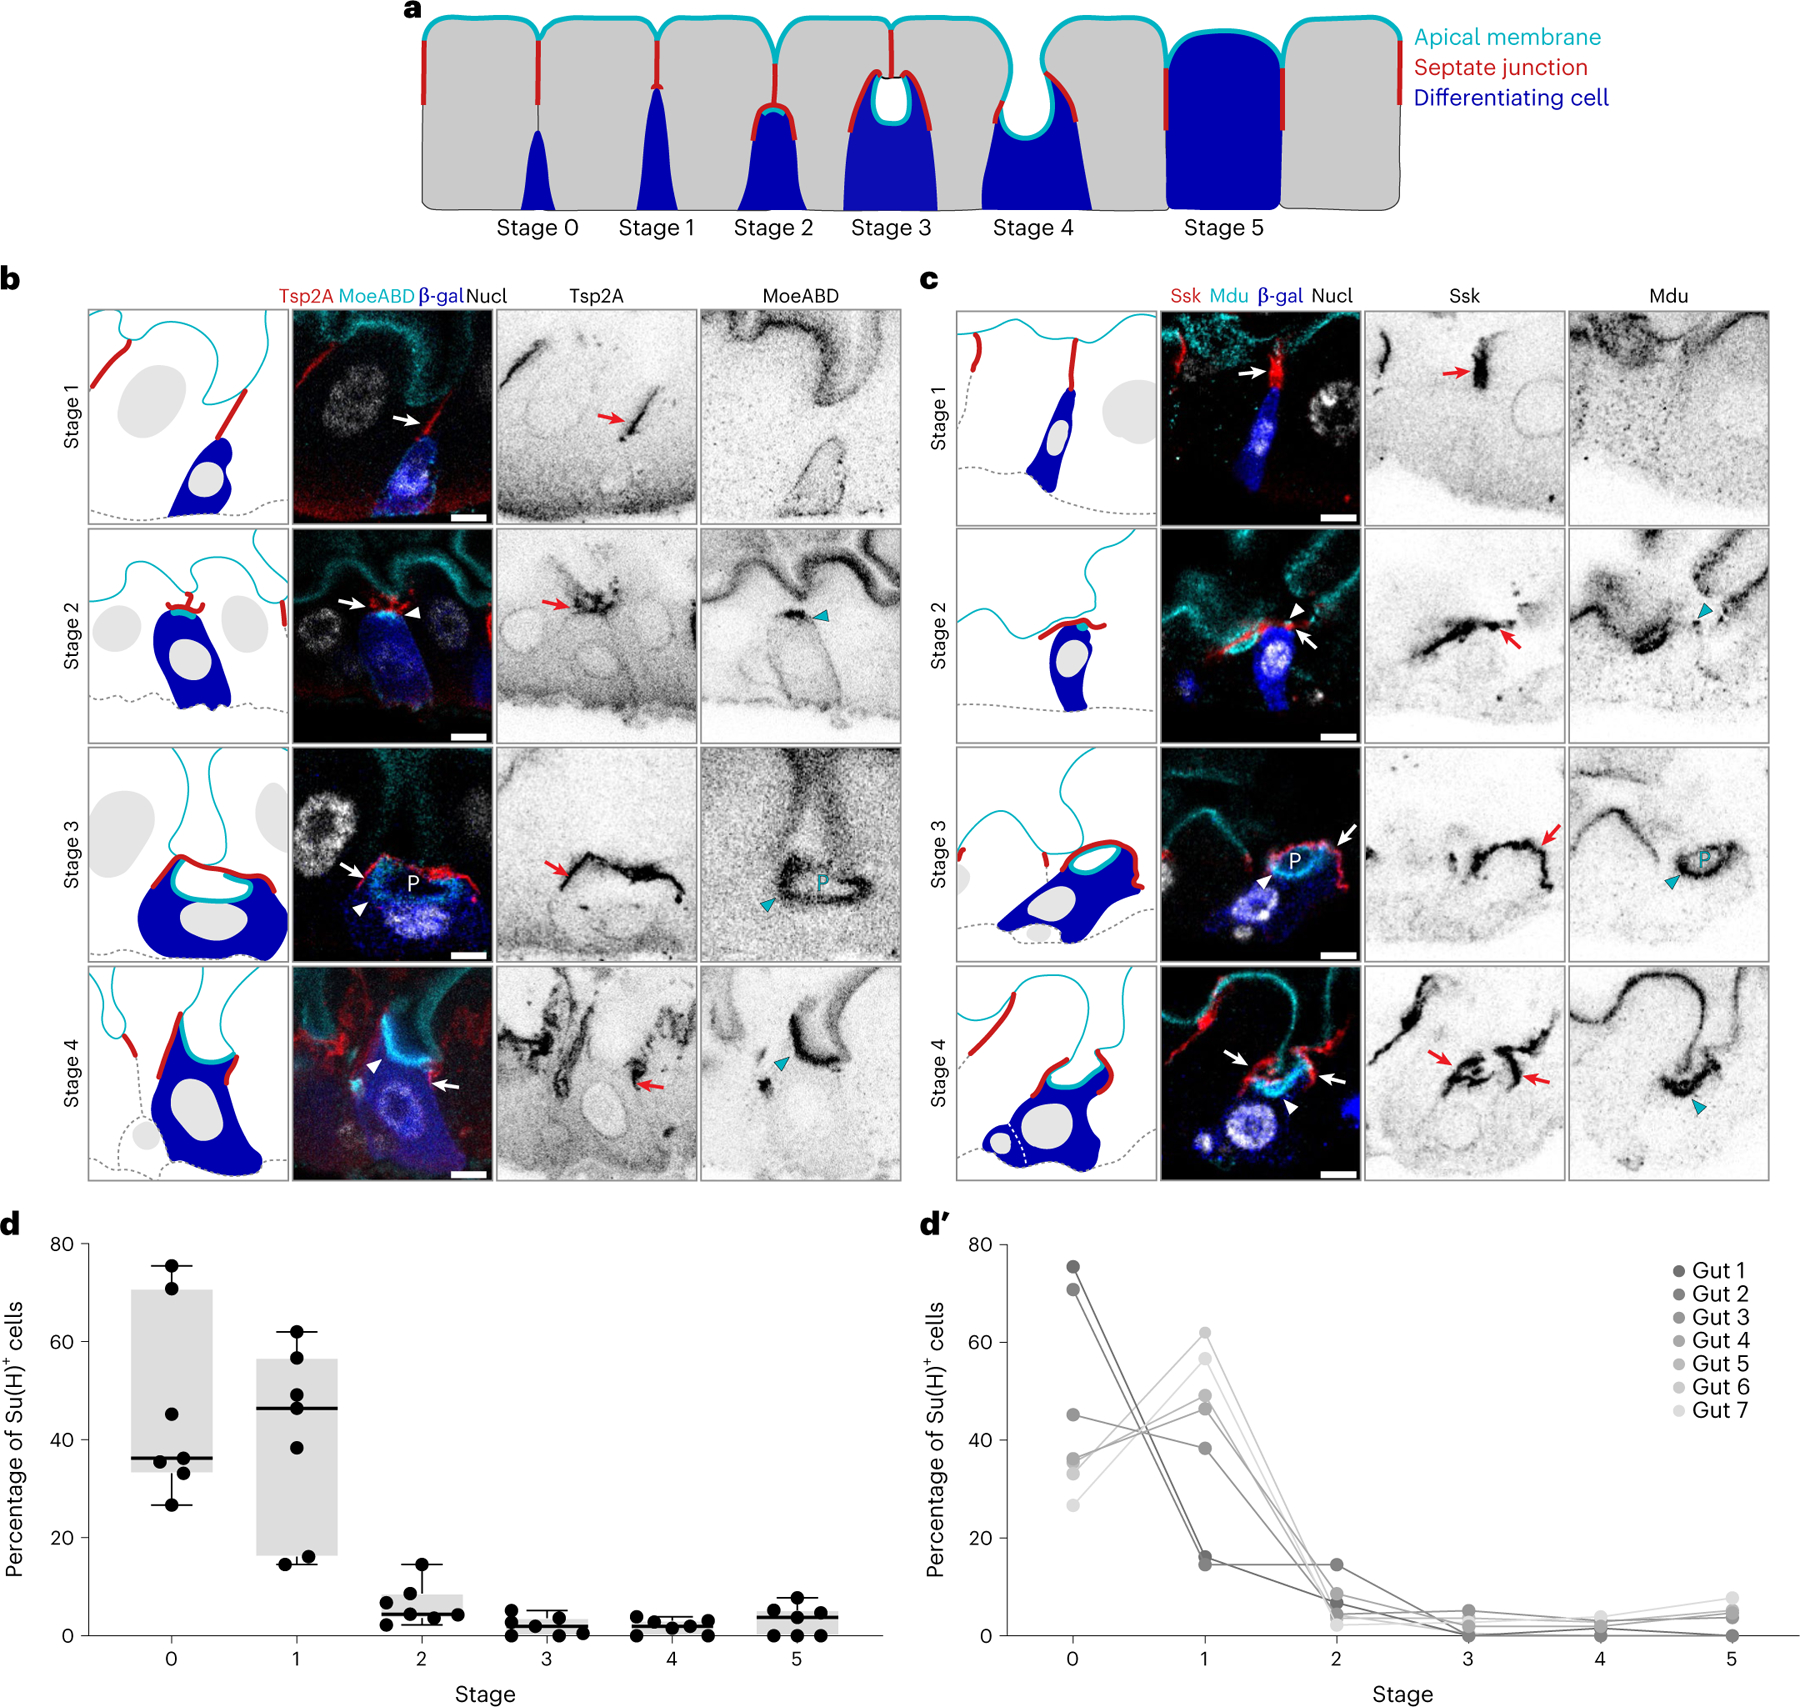
Fig. 2 |. SJ and apical membrane morphology define six stages of barrier integration.

a, Cartoon model of stages 0–5 of cell integration depicting enteroblasts/pre-enterocytes (blue), apical membrane (cyan), SJ (red) and enterocytes (grey). b,c, Immunofluorescent images of Su(H)-lacZ+ cells in stages 1–4. Representative images collected from 40 guts in two independent experiments. SJs shown in red (b, Tsp2A; c, Ssk), marked by arrows. Apical markers shown in cyan (b, MoeABD::GFP; c, Mdu::GFP), and apical markers of Su(H)-lacZ+ cells marked by arrowheads. PAC (P) noted in stage 3 cells. Su(H)-lacZ in blue (b and c, β-gal). Nuclei (Nucl) shown in greyscale (b, His2av::mRFP; c, DAPI). Images are projections of short confocal stacks. Scale bars, 5 μm. β-Gal channel is shown in Extended Data Fig. 2. Full genotypes are in Supplementary Table 1. d,d′, Percentage of Su(H)-lacZ+ cells in each integration stage (N = 7 guts; n = 293, 180, 292, 192, 192, 187 and 248 cells). Box plot displays median as centre line, the bounds of the box represent the first and third quartiles, and whiskers show the minimum and maximum values (d). Line graphs of individual gut samples (d′).
