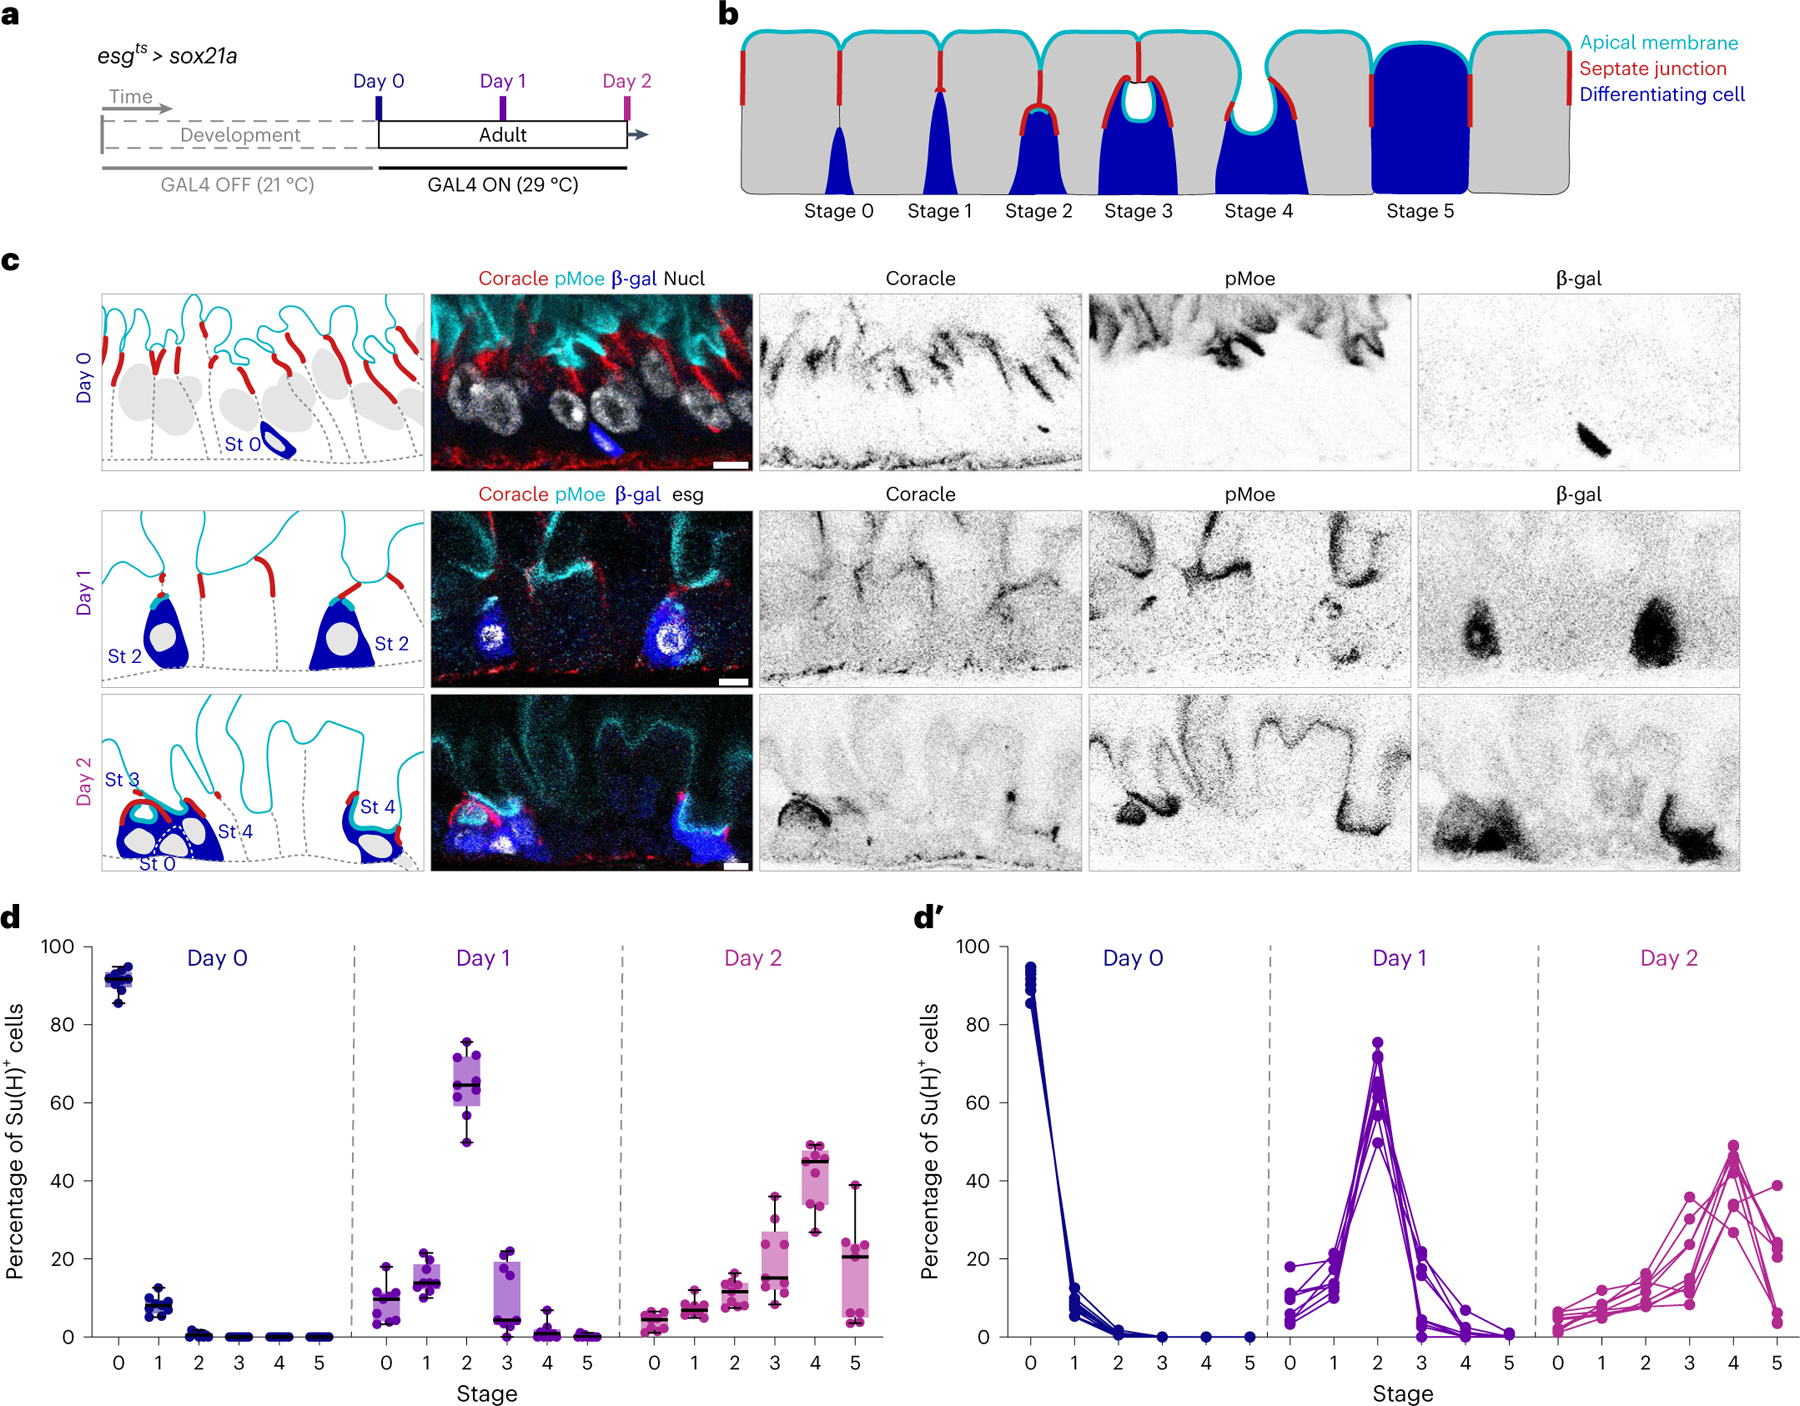
Fig. 3 |. Synchronized differentiation drives Su(H)-lacZ+ cells through sequential stages of PAC integration.

a, Experimental design for synchronizing enteroblast-to-enterocyte differentiation. esgts-controlled expression of the terminal differentiation factor Sox21a was induced by 29 °C temperature shift at adult day 0 to drive differentiation of a large cohort of enteroblasts born during the first 24 h post-eclosion. UAS-his2b::CFP and Su(H)-lacZ were also included to mark Sox21a-expressing cells and enteroblasts/pre-enterocytes, respectively. Full genotypes are in Supplementary Table 1. Guts were dissected before induction at day 0 or after induction at day 1 or 2. b, Model of PAC integration. Apical membrane (cyan), SJ (red) and enteroblast/pre-enterocytes (blue). c, Representative images collected from 27 guts in three independent experiments with immunostaining for β-gal (blue), the apical marker phospho-Moesin (pMoe; cyan), and the SJ marker Coracle (red). Nuclear stains (greyscale) are DAPI (day 0; esgts was inactive in day 0 guts) and esgts-driven his2b::CFP (days 1 and 2). Day 0 enterocytes have higher density because the gut lumen is not yet distended by ingested food. Scale bars, 5 μm. d,d′, Quantitation of stages over time. Box plots (d) show the aggregate stage distribution of all Su(H)-lacZ+ cells counted at days 0, 1 and 2 (N = 9 guts per timepoint; n = 6,596 cells total). Box plots display median as centre line, the bounds of the box represent the first and third quartiles, and minimum and maximum values are shown by whiskers (d). Line graphs of individual gut samples (d′).
