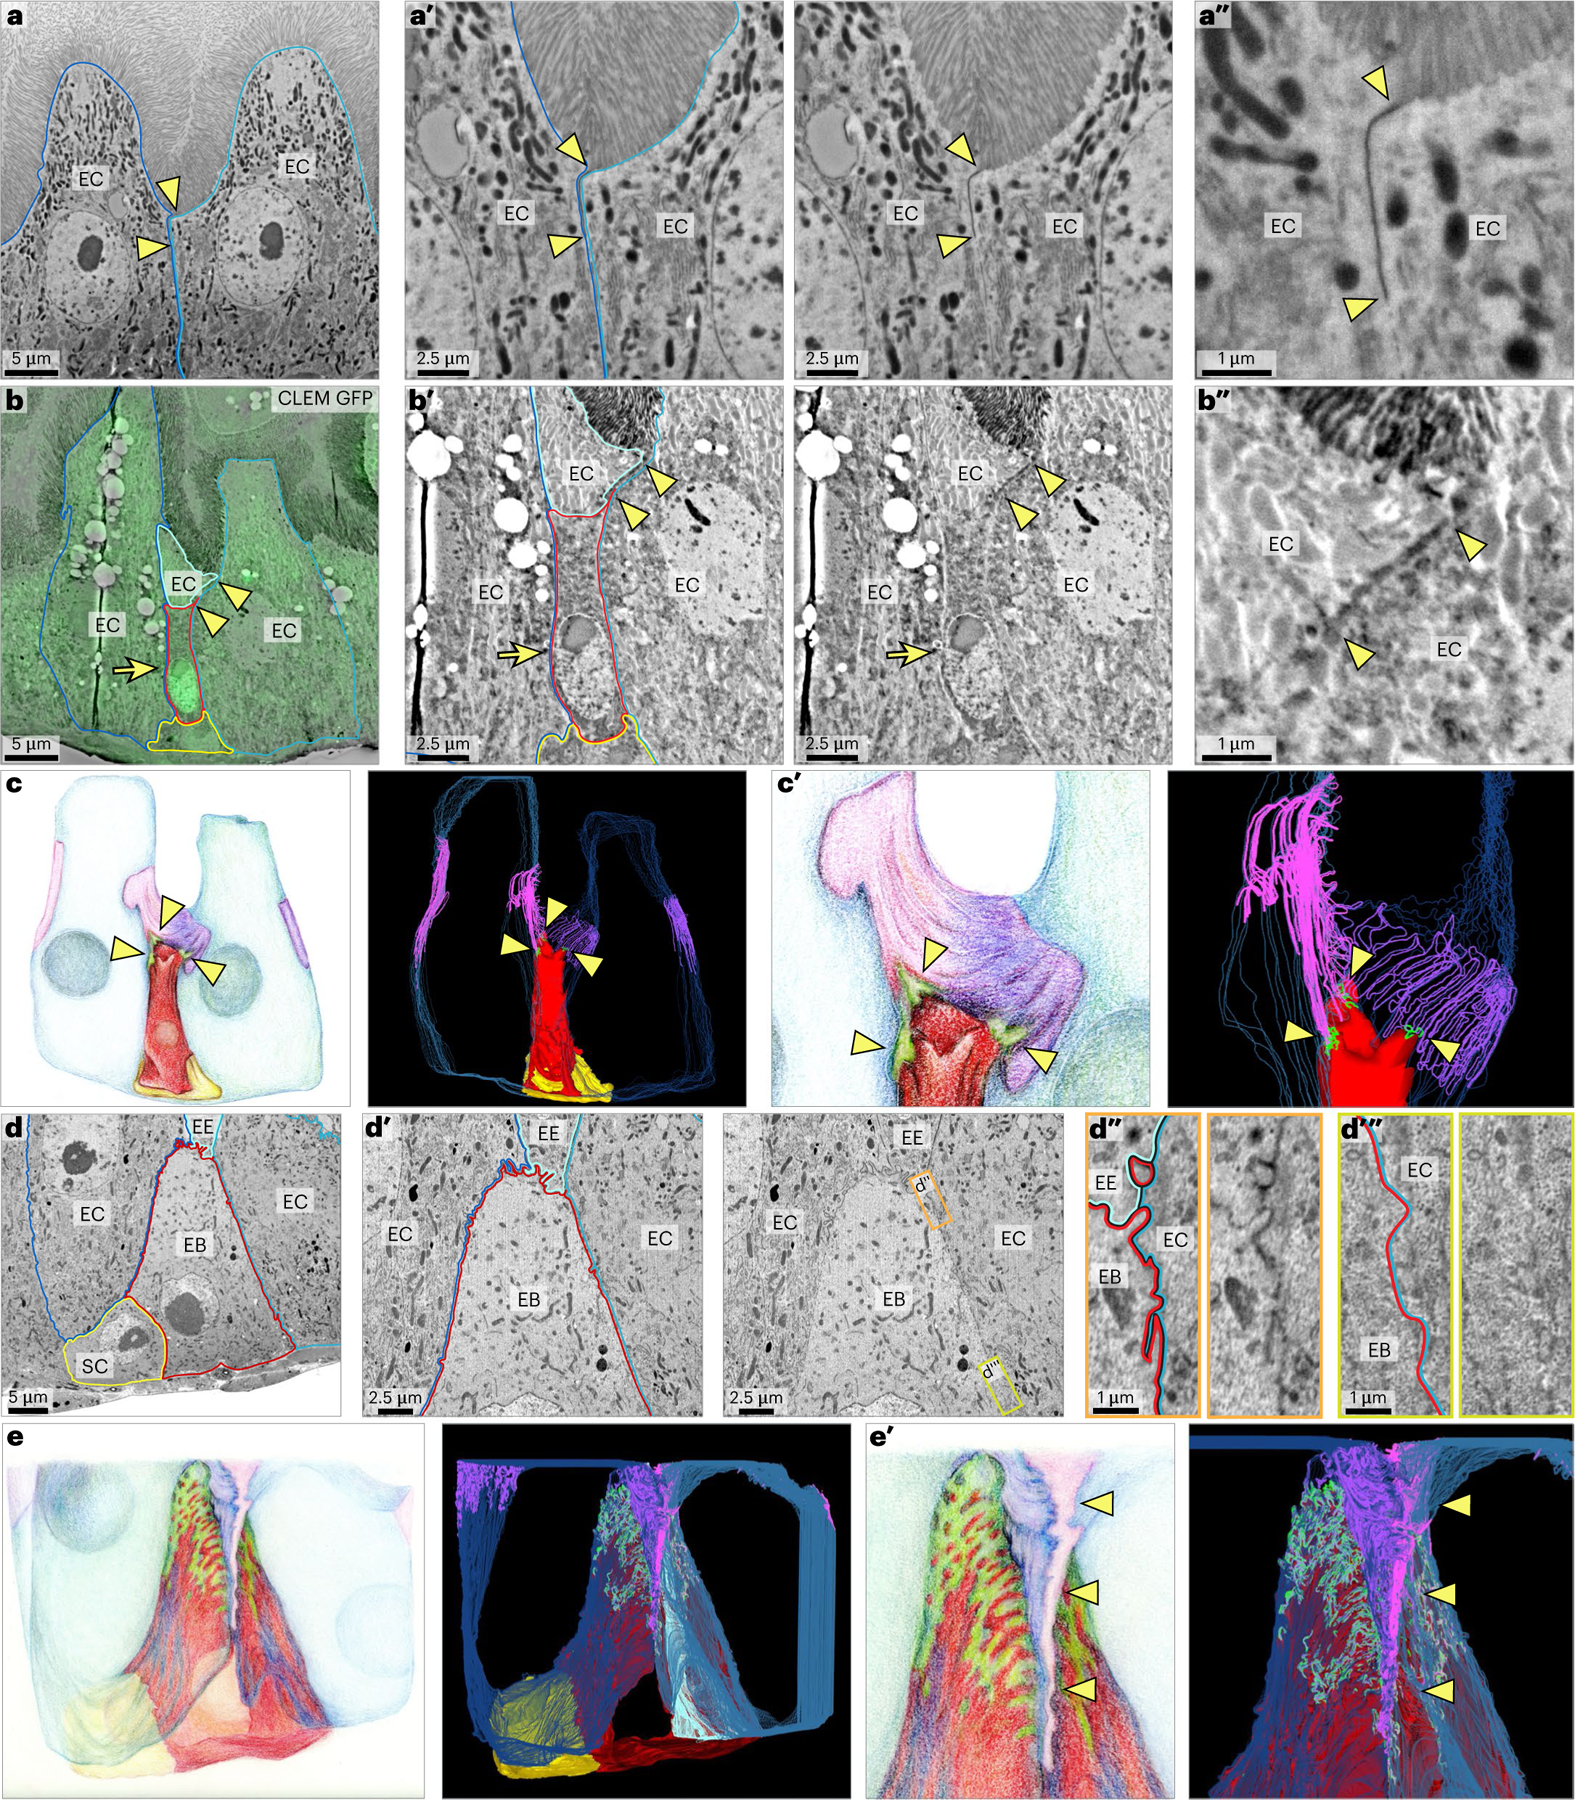
Fig. 5 |. FIB-SEM reveals the 3D ultrastructure of early-stage SJs.

a, Enterocyte–enterocyte SJs localize at the boundary between the lumenal brush border and lateral plasma membranes. SEM shows two enterocytes (EC, outlined in blue and teal). Arrowheads indicate the apical and basal edges of the enterocyte–enterocyte SJ. a′,a″, Zoomed-in views of a with and without coloured outlines. Image is representative of 20 enterocyte–enterocyte SJs from three guts in a single experiment. b,b′,b′′,c,c′, A stage 1 enteroblast (EB) forms nascent SJPC–EC with enterocytes. CLEM overlay (b) identifies a Su(H)-GFP:nls+ enteroblast (arrow, GFP:nls; red outline, enteroblast) in an array tomography section. Morphology and position characterize the enteroblast as stage 1. Portions of three neighbour enterocytes (outlined in blue, teal and cyan) and a presumptive stem cell (SC, yellow outline) are visible. Arrowheads point to the apical and basal edges of an SJ with apical SJEC–EC between two ECs and basal SJPC–EC between the enteroblast and an EC. Zoomed-in views of b with and without coloured outlines (b′,b″). Illustration (c) and volumetric rendering (c′) of 30-slice FIB-SEM dataset spanning the enteroblast in b (red). Arrowheads point to three enteroblast SJPC–EC (green) that have formed with ECs (blue). SJPC–EC are continuous with SJEC–EC (EC SJ; pink, purple and lavender). A stem cell is also visible (yellow). Image is representative of two stage 1 enteroblasts from two guts in a singleexperiment. See Supplementary Video 2. d,d′,d″,d′′′,e, SJ basal zone of a stage 2 enteroblast. Single section (d) from 415-slice FIB-SEM dataset. Outlines show an enteroblast (red), two enterocytes (blue and teal), an enteroendocrine cell (EE, cyan) and a presumptive stem cell (yellow). The enteroblast’s slightly enlarged size is indicative of stage 2. Zoomed-in view (d′) of d with and without coloured outlines. Inset (orange) (d″) of d′ with and without coloured outlines. Inset shows EB–EC cell interface at the changeover point between SJEC–EC and SJPC–EC. EE is also in frame with SJPC-EE and SJEC-EE in view. Inset (yellow-green) (d′′′) of d′ with and without coloured outlines. Inset shows EB–EC cell interface along basolateral membrane in region devoid of SJs. Image is representative of one stage 2 enteroblast in a single experiment. See Extended Data Fig. 6. Illustration and volumetric rendering (e) of 415-slice FIB-SEM dataset, including the image in d. Enteroblast (red), enterocytes (blue and teal), enteroendocrine cell (cyan), stem cell (yellow), SJPC–EC (green) and EC SJ (purple and pink). Zoomed-in illustration and volumetric rendering of SJ basal zone from e (e′). Arrowheads point to basally extended SJEC–EC at the interface between ECs. See Supplementary Video 3. Full genotypes are in Supplementary Table 1. Scale bars, 5 μm (a, b and d), 2.5 μm (a′, b′ and d′) or 1 μm (a″, b″, d″ and d′′′).
