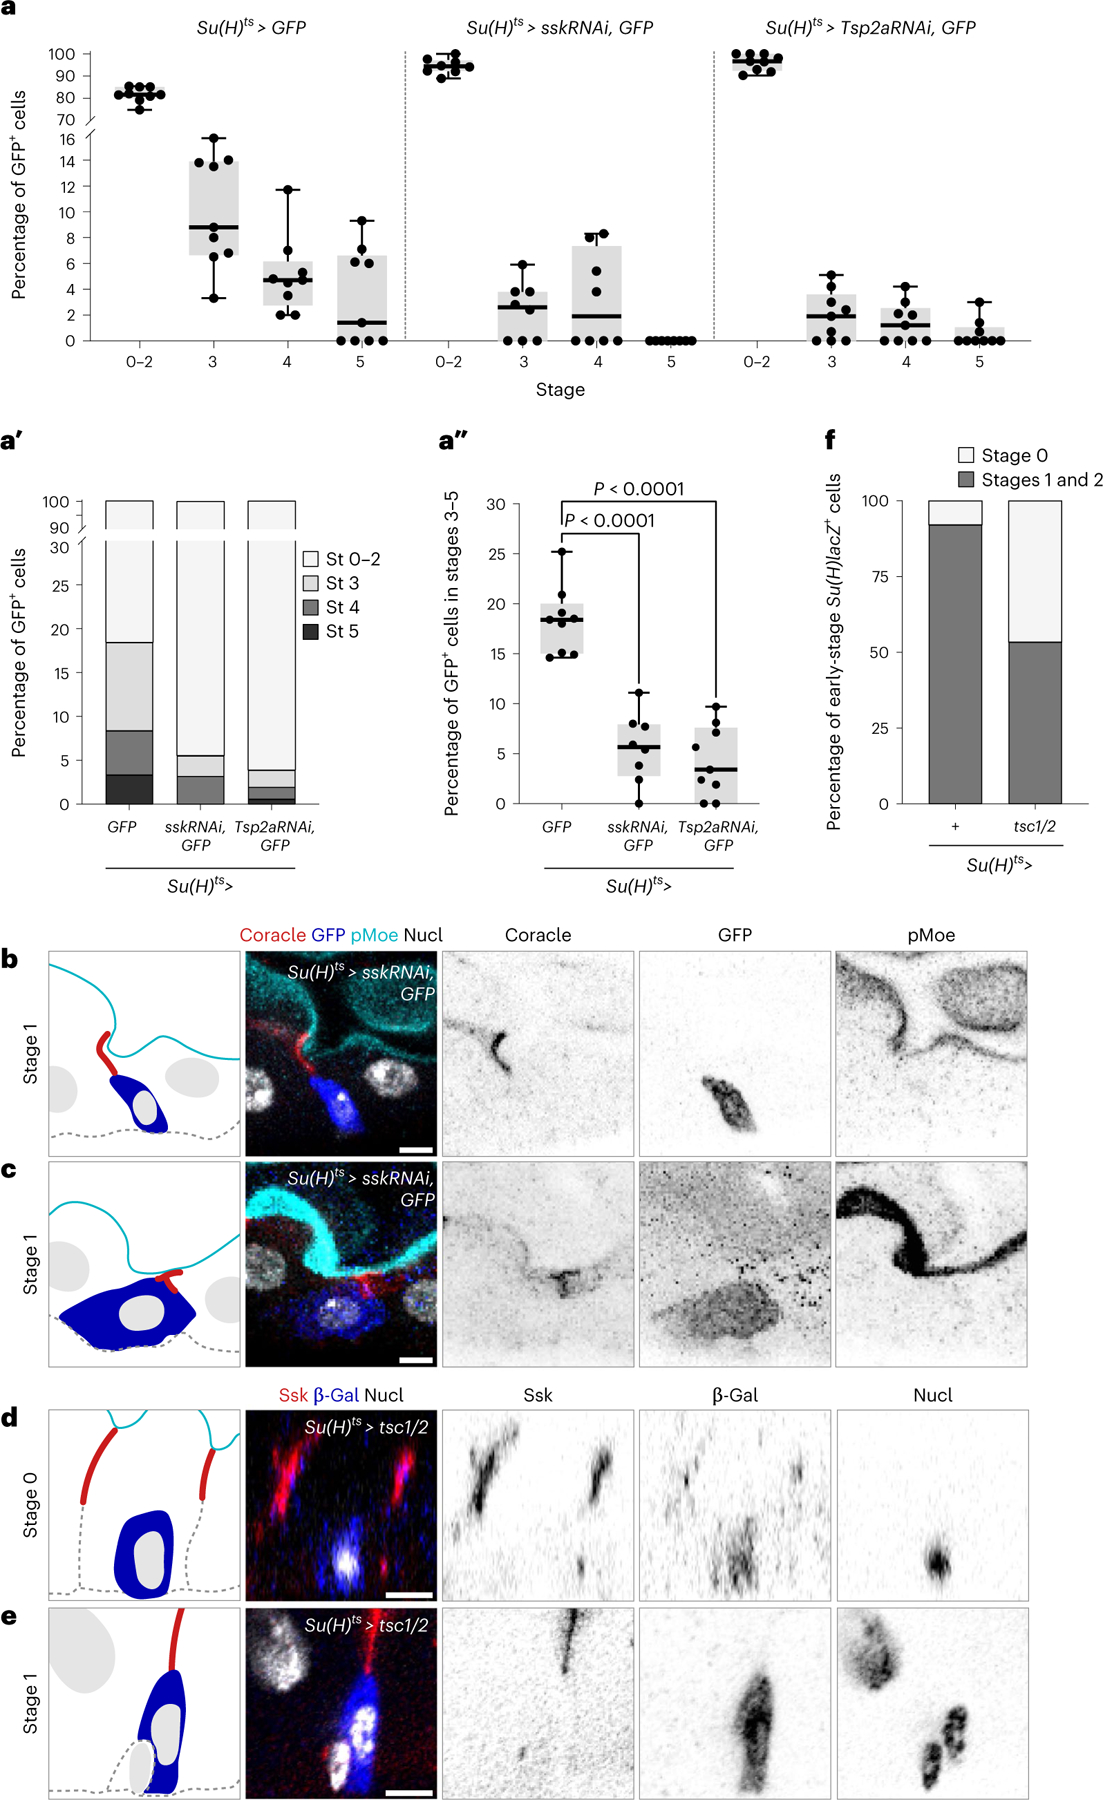
Fig. 6 |. Cells must form SJs and grow to integrate.

a–c, Knockdown of SJ components inhibits progression to late stages (St). a–a″, Percentage of Su(H)ts > GFP+ cells in each integration stage in midguts of the indicated genotypes. Su(H)ts > GFP (N = 9 guts; n = 1095 total cells), Su(H)ts > sskRNAi, GFP (N = 8 guts; n = 336 total cells), and Su(H)ts > Tsp2aRNAi, GFP (N = 9 guts; n = 801 total cells). Box plot displays median as centre line, the bounds of the box represent the first and third quartiles, minimum and maximum values are shown by whiskers. Each data point represents one midgut. Su(H)ts > GFP versus Su(H)ts > sskRNAi (two-tailed Student’s t-test, P = 3.5 × 10⁻⁶), Su(H)ts > GFP versus Su(H)ts > Tsp2aRNAi (two-tailed Student’s t-test, P = 4 × 10⁻⁷) (a″). b,c, Immunofluorescent images of Su(H)ts > sskRNAi, GFP cells in stage 1. Representative images collected from eight guts in three independent experiments. Apical marker (pMoe; cyan), SJs (Coracle; red), Su(H)ts > GFP (blue), and nuclei (DAPI; greyscale). d–f, Growth inhibition blocks progression to late stages. Representative immunofluorescent images of Su(H)ts > tsc1/2; Su(H)-lacZ cells in stage 0 (d) and stage 1 (e) from a single experiment. SJs (Ssk, red), Su(H)-lacZ, (β-gal, blue) and nuclei (DAPI, greyscale). Percentage of early-stage (stages 0–2) Su(H)-lacZ+ cells in either stage 0 (no SJ contact) or stages 1–2 (SJ contact) (f). Su(H)ts/+ (N = 3, n = 214 stage 0–2 cells; stage 3–5 cells were observed but not included in analysis) and Su(H)ts > tsc1/2 (N = 3, n = 146 stage 0–2 cells; no stage 3–5 cells were observed). Scale bars, 5 μm. Full genotypes are in Supplementary Table 1.
