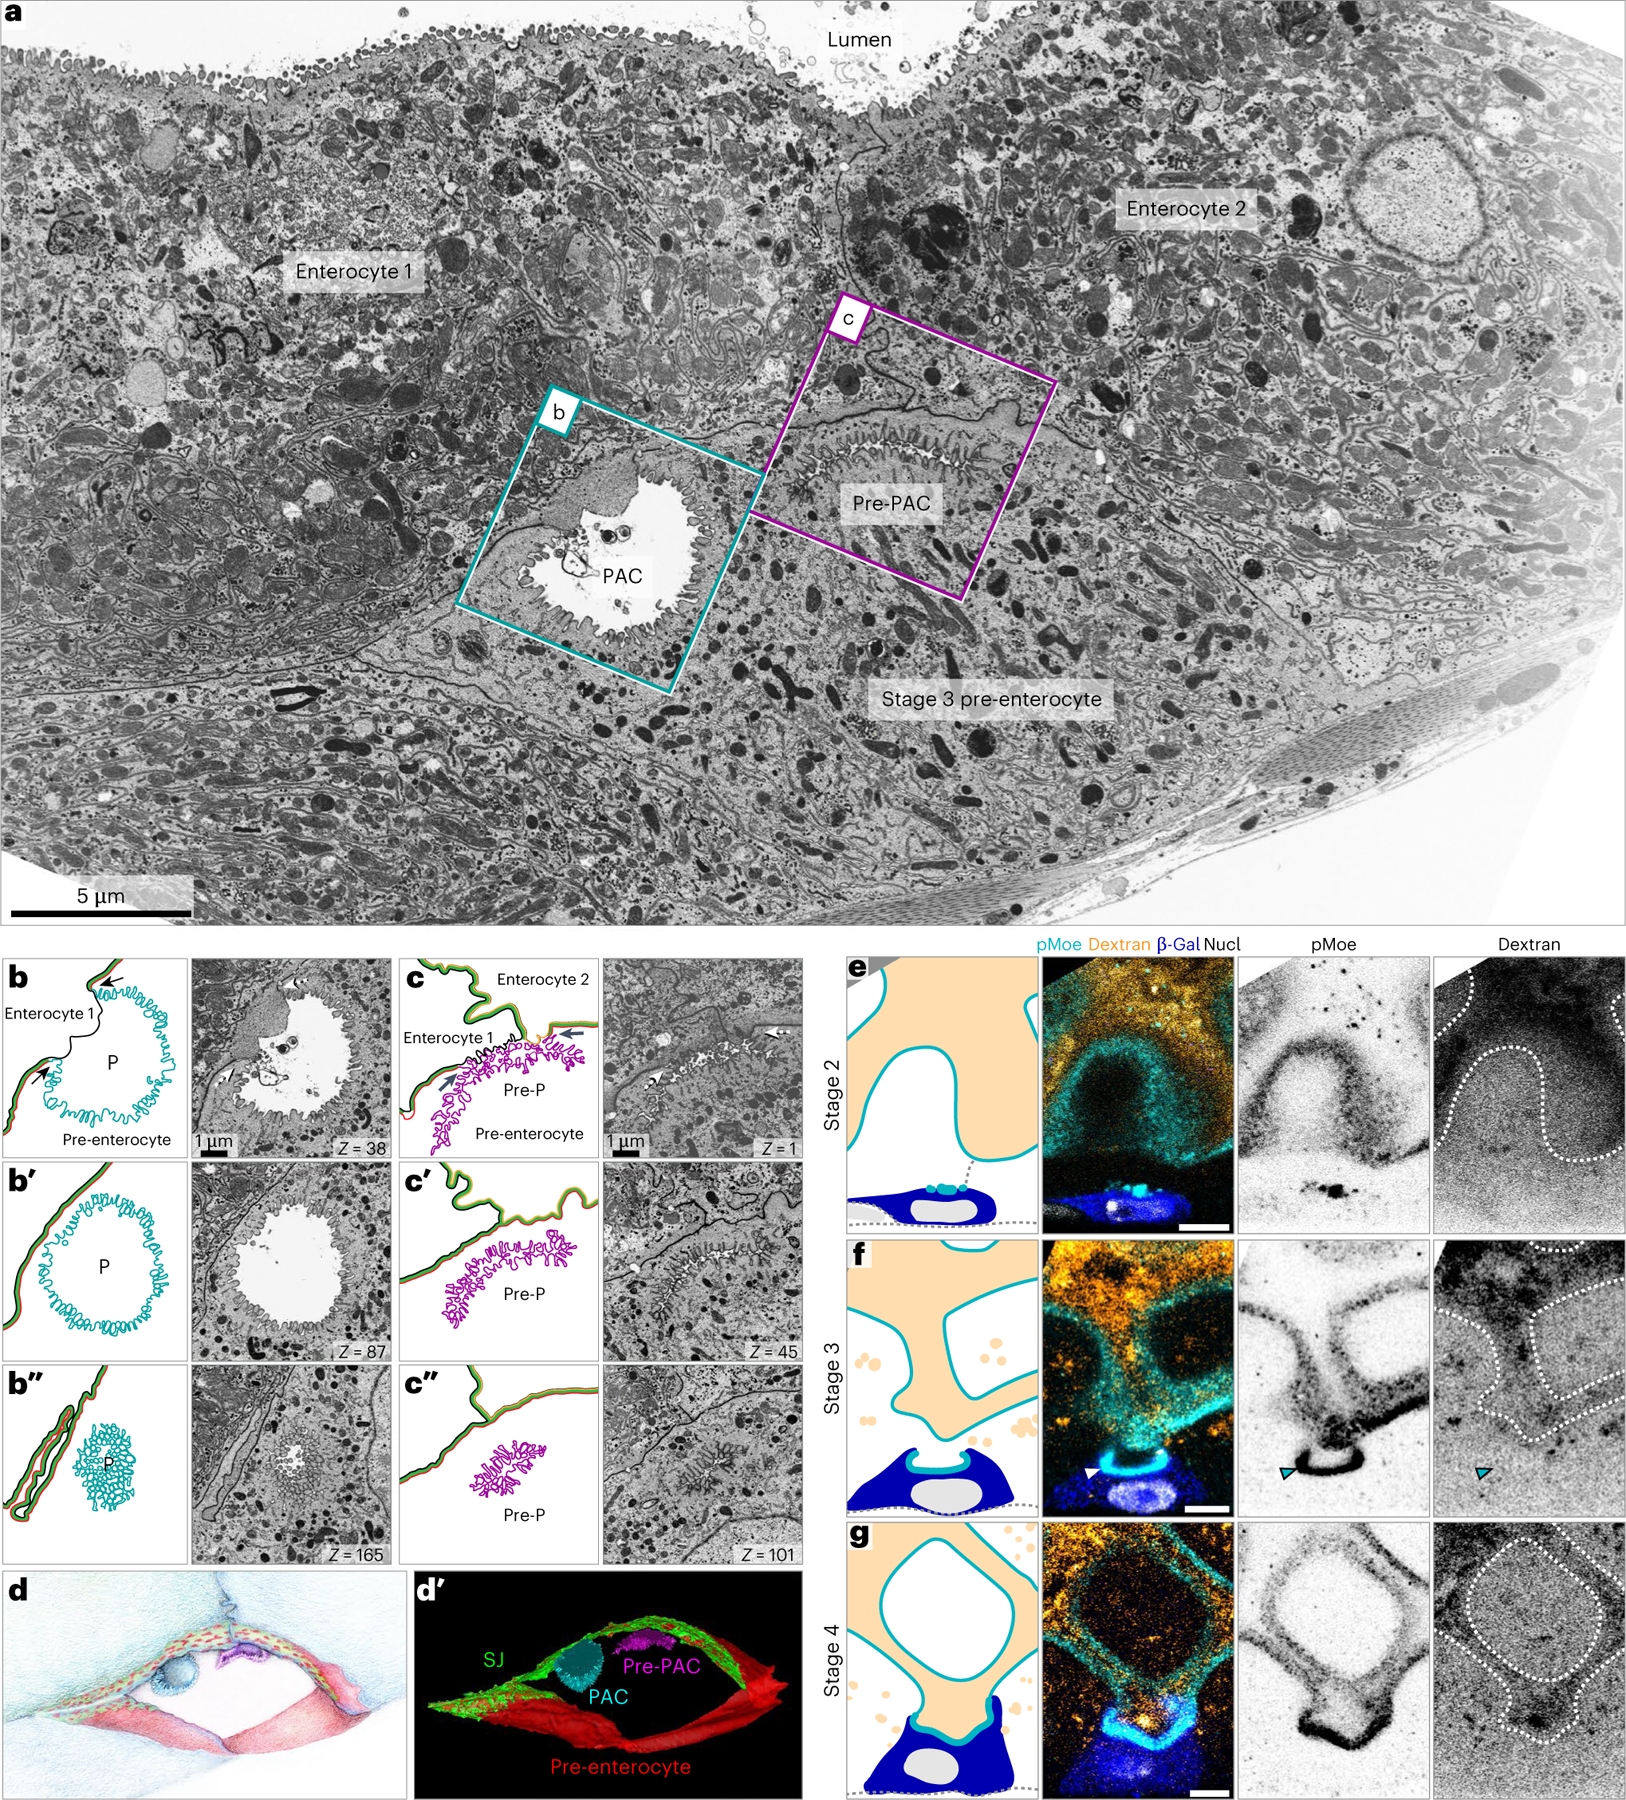
Fig. 7 |. PACs are intercellular, split-polarity lumens that are sealed off from the gut lumen.

a, One slice from a representative, 200-slice FIB-SEM tomographic series (40.2 μm × 23.9 μm × 8 μm). Series captures two mature enterocytes and a pre-enterocyte. A PAC and a PAC precursor (Pre-PAC) appear at the apex of the pre-enterocyte. b–b″, Inset of the PAC (P) in cyan box in a. Three FIB-SEM sections are shown next to cartoon representations. Pre-enterocyte’s apical membrane (cyan), pre-enterocyte’s basolateral membrane (red), Enterocyte 1’s basolateral membrane (black) and SJ (green). Arrows in b point to the three-way boundary between the pre-enterocyte apical membrane, Enterocyte 1’s basolateral membrane and the pre-enterocyte basolateral membrane. c–c″, Inset of the PAC precursor (pre-P) in magenta box in a. Pre-enterocyte’s apical membrane (magenta), pre-enterocyte’s basolateral membrane (red), Enterocyte 1’s basolateral membrane (black), Enterocyte 2’s basolateral membrane (orange) and SJ (green). Arrows in c point to two three-way boundaries between the pre-enterocyte apical membrane, the basolateral membrane of either Enterocyte 1 or Enterocyte 2, and the pre-enterocyte basolateral membrane. In a–c, Z values in lower right of panels are slice numbers. Images are representative of four PACs/pre-PACs from two guts from a single experiment. d,d′, Illustration (d) and volumetric rendering (d′) of 200 FIB-SEM sections, including the section in a. PAC (cyan), PAC precursor (magenta; Pre-PAC), pre-enterocyte’s basolateral membrane (red) and SJ (green). Enterocyte membranes not shown. See Supplementary Video 4. e–g, Immunofluorescent images of Su(H)-lacZ+ cells in guts of flies fed Alexa Fluor 647-conjugated 10 kDa dextran dye for 48 h. e–g are representative images of 1,000 cells examined from four guts from a single experiment: stage 2 (e), stage 3 (f) and stage 4 (g). Apical membrane (pMoe; cyan), dextran dye (orange), Su(H)-lacZ+ cells (β-gal; blue), and nuclei (DAPI, greyscale). Full genotypes are in Supplementary Table 1. Scale bars, 5 μm (a and e–g) or 1 μm (b and c).
