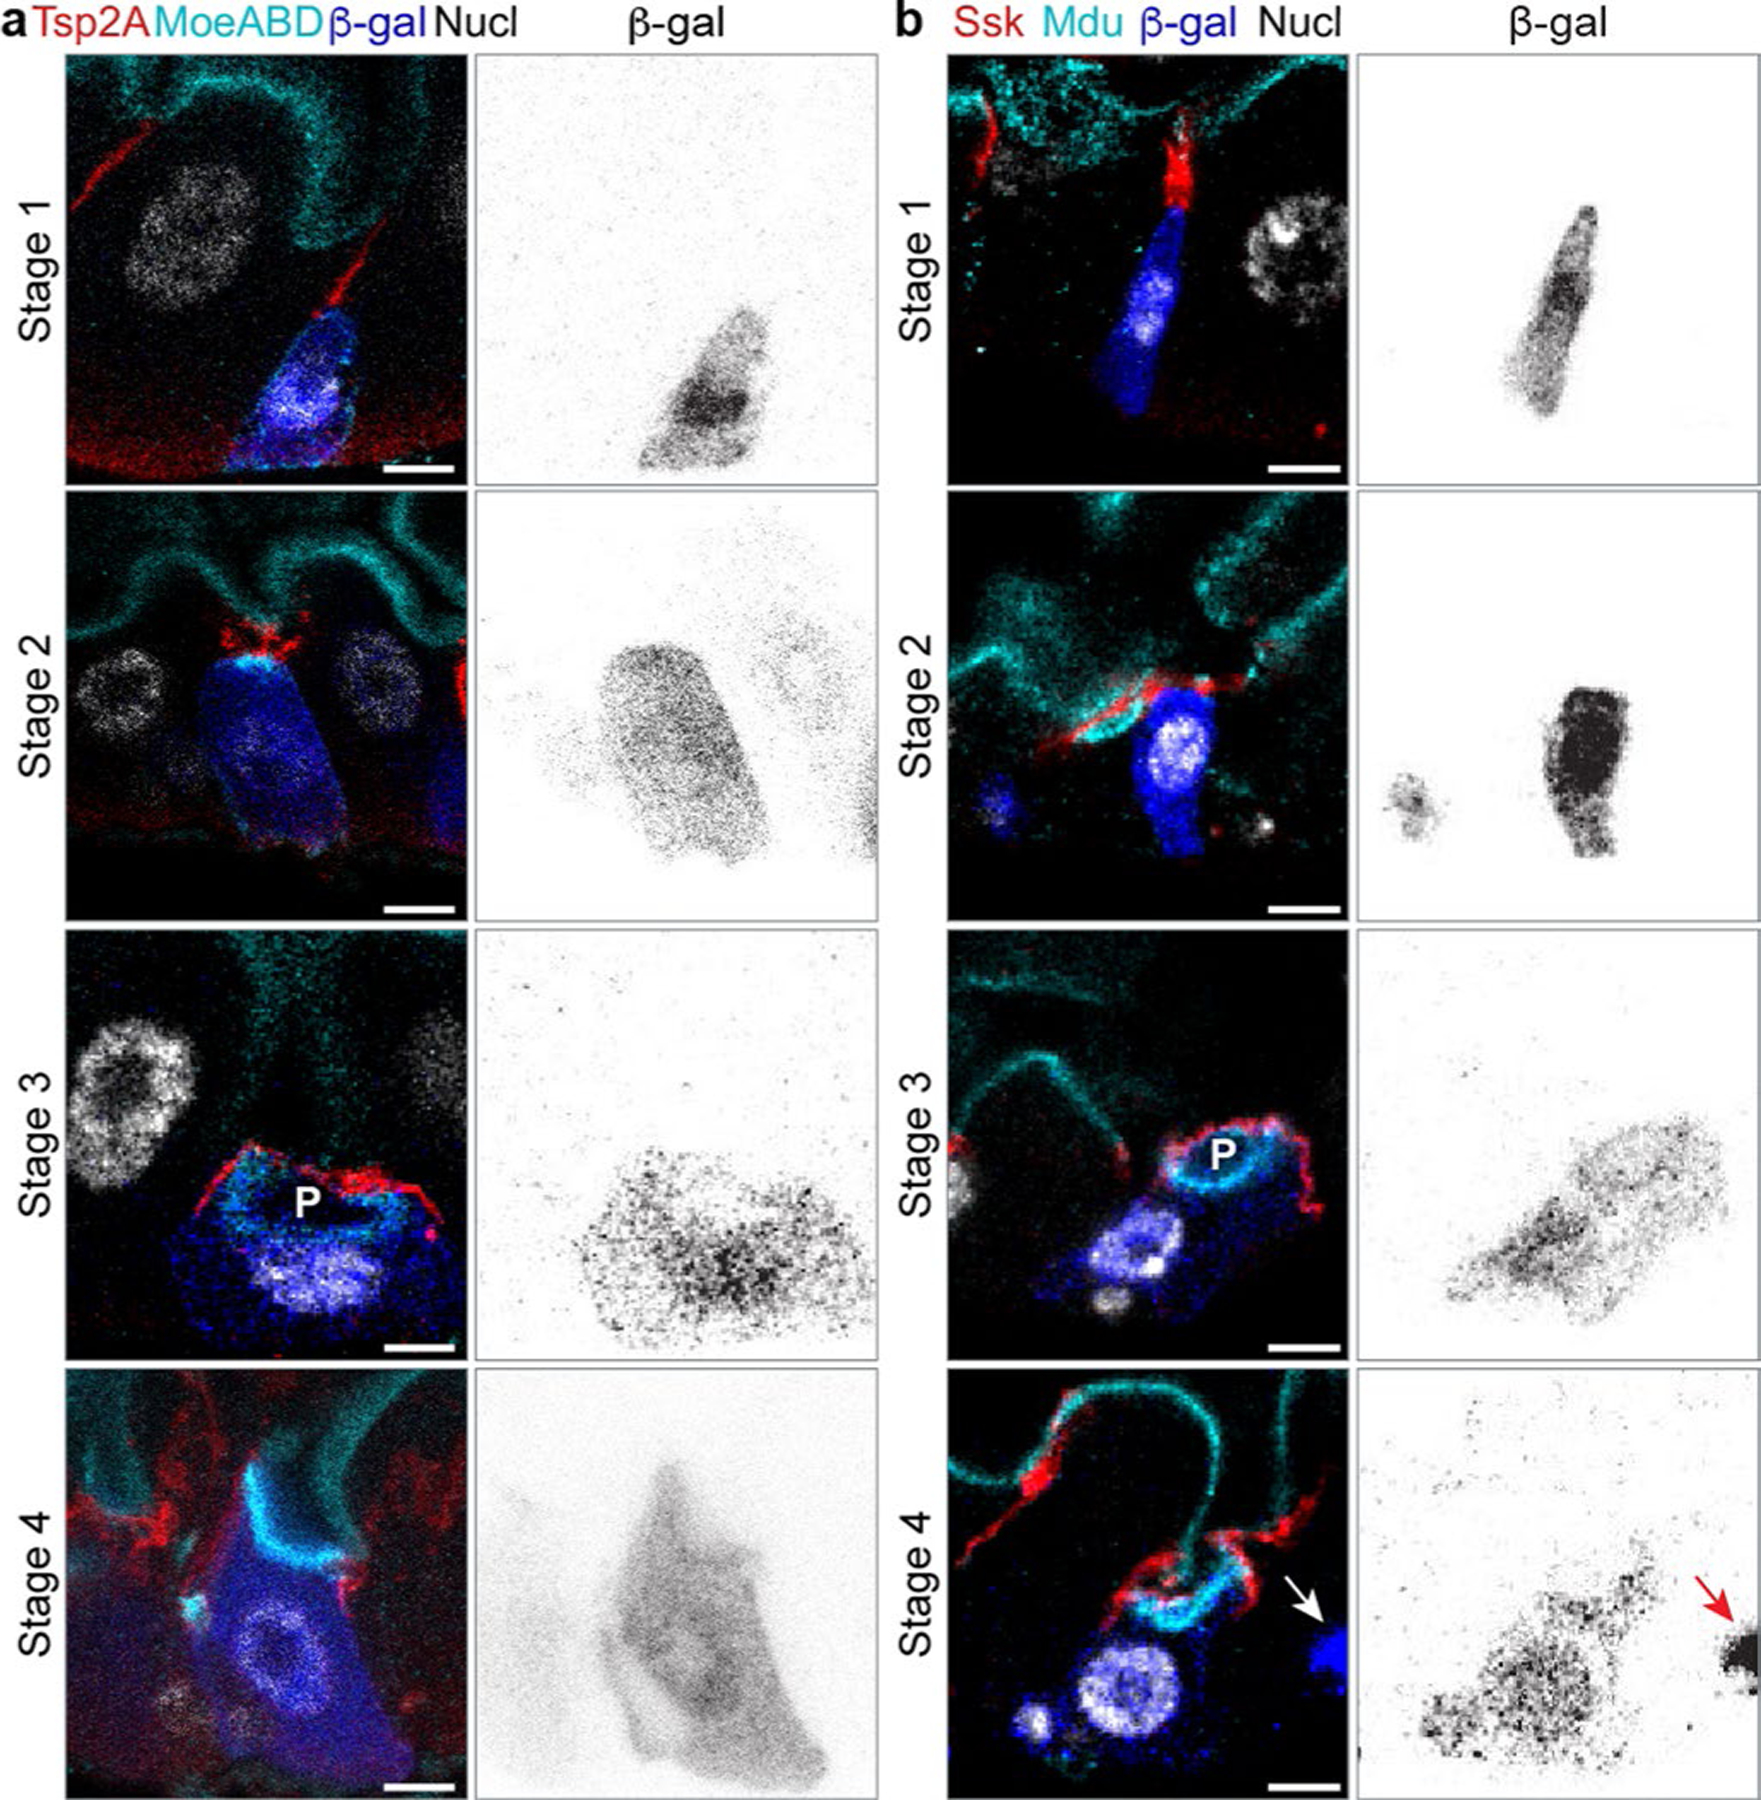
Extended Data Fig. 2 |. Same images as Fig. 2b,c, showing Su(H)-lacZ expression (b-galactosidase immunostain).

a-b, Multi-channel and β-galactosidase channel view of the same images as Fig. 2b,c. The presence of β-galactosidase in Stage 3 and Stage 4 cells demonstrates that these cells derived recently from enteroblasts. During acquisition of the Stage 3 and 4 images, the gain was increased compared to Stages 1 and 2 to visualize lower levels of β-galactosidase. Arrows in (b) point to a Stage 1 enteroblast next to the Stage 4 pre-enterocyte; at the higher gain necessary to visualize β-galactosidase in the Stage 4 pre-enterocyte, β-galactosidase intensity in the Stage 1 enteroblast is overexposed. Panels (a,b) are representative images collected from 40 guts in 2 independent experiments. Images are projections of short confocal stacks. Scale bars, 5 μm. Full genotypes in Supplementary Table 1.
