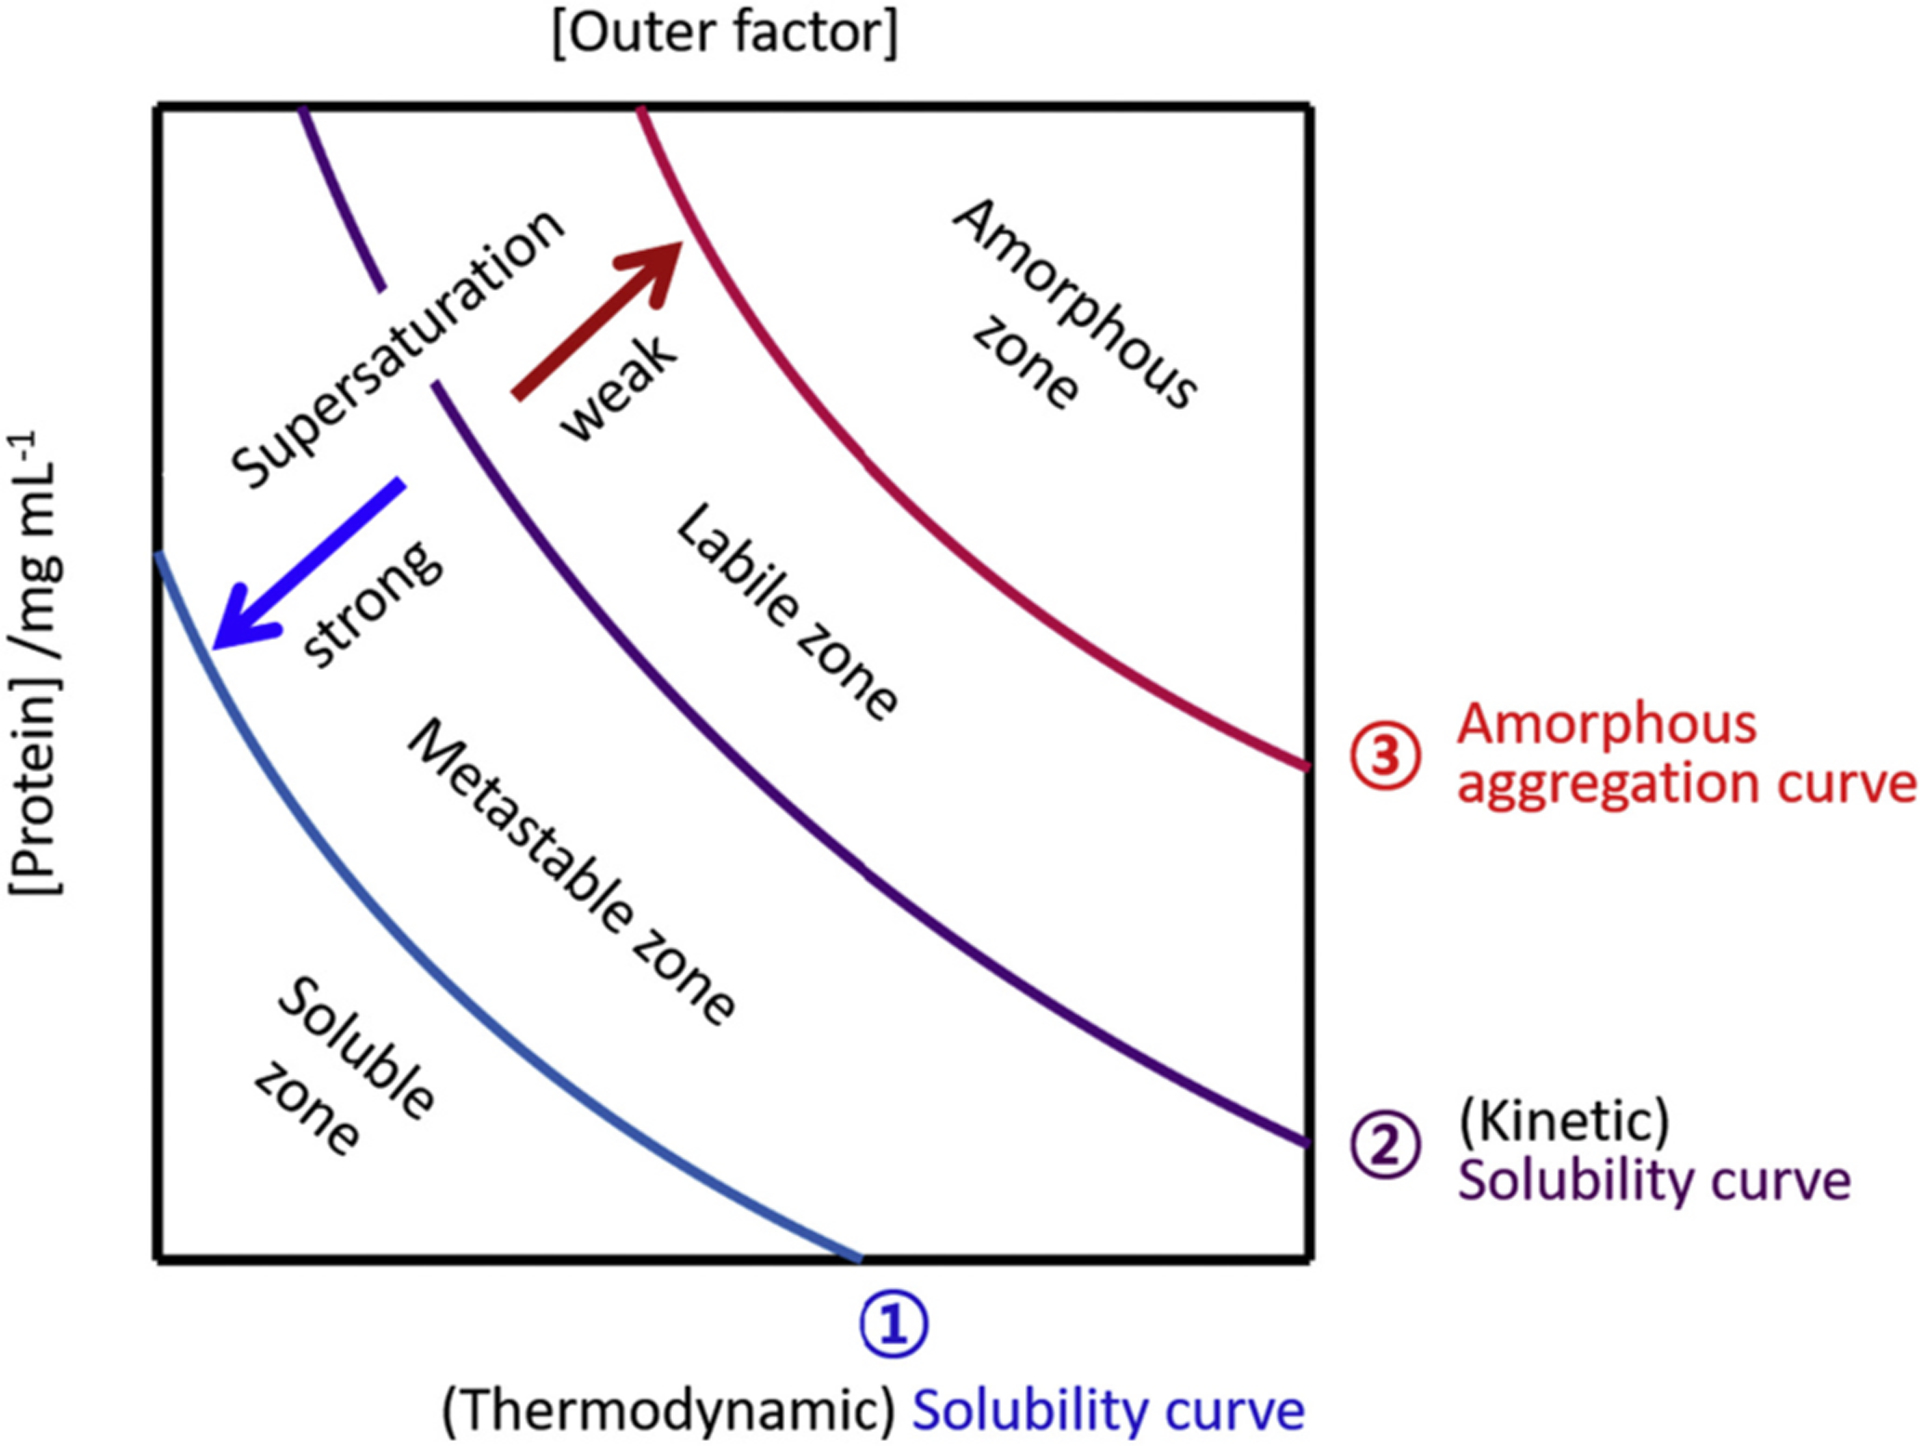
Fig. 8.

A phase diagram of nucleation-dependent amyloid formation. A typical phase diagram that explains the solubility and supersaturation-limited amyloid formation. Each region of the phase diagram designate the distinct phase properties of the amyloid proteins. These regions are labeled and separated by curves (labeled as 1, 2 and 3) which control the aggregation behaviors. The (thermodynamic) solubility curve in saturation is labeled as curve-1 (blue) and the (kinetic) solubility curve (or a metastability of supersaturation curve) is curve-2 (magenta). Curve-3 (red) is the amorphous aggregation curve. Strength of supersaturation is guided with two arrows. x and y axes indicate the concentration of proteins and external factors such as the concentration of salt, crowders, organic solvent, temperature, etc, respectively.
