
Fig. 9.
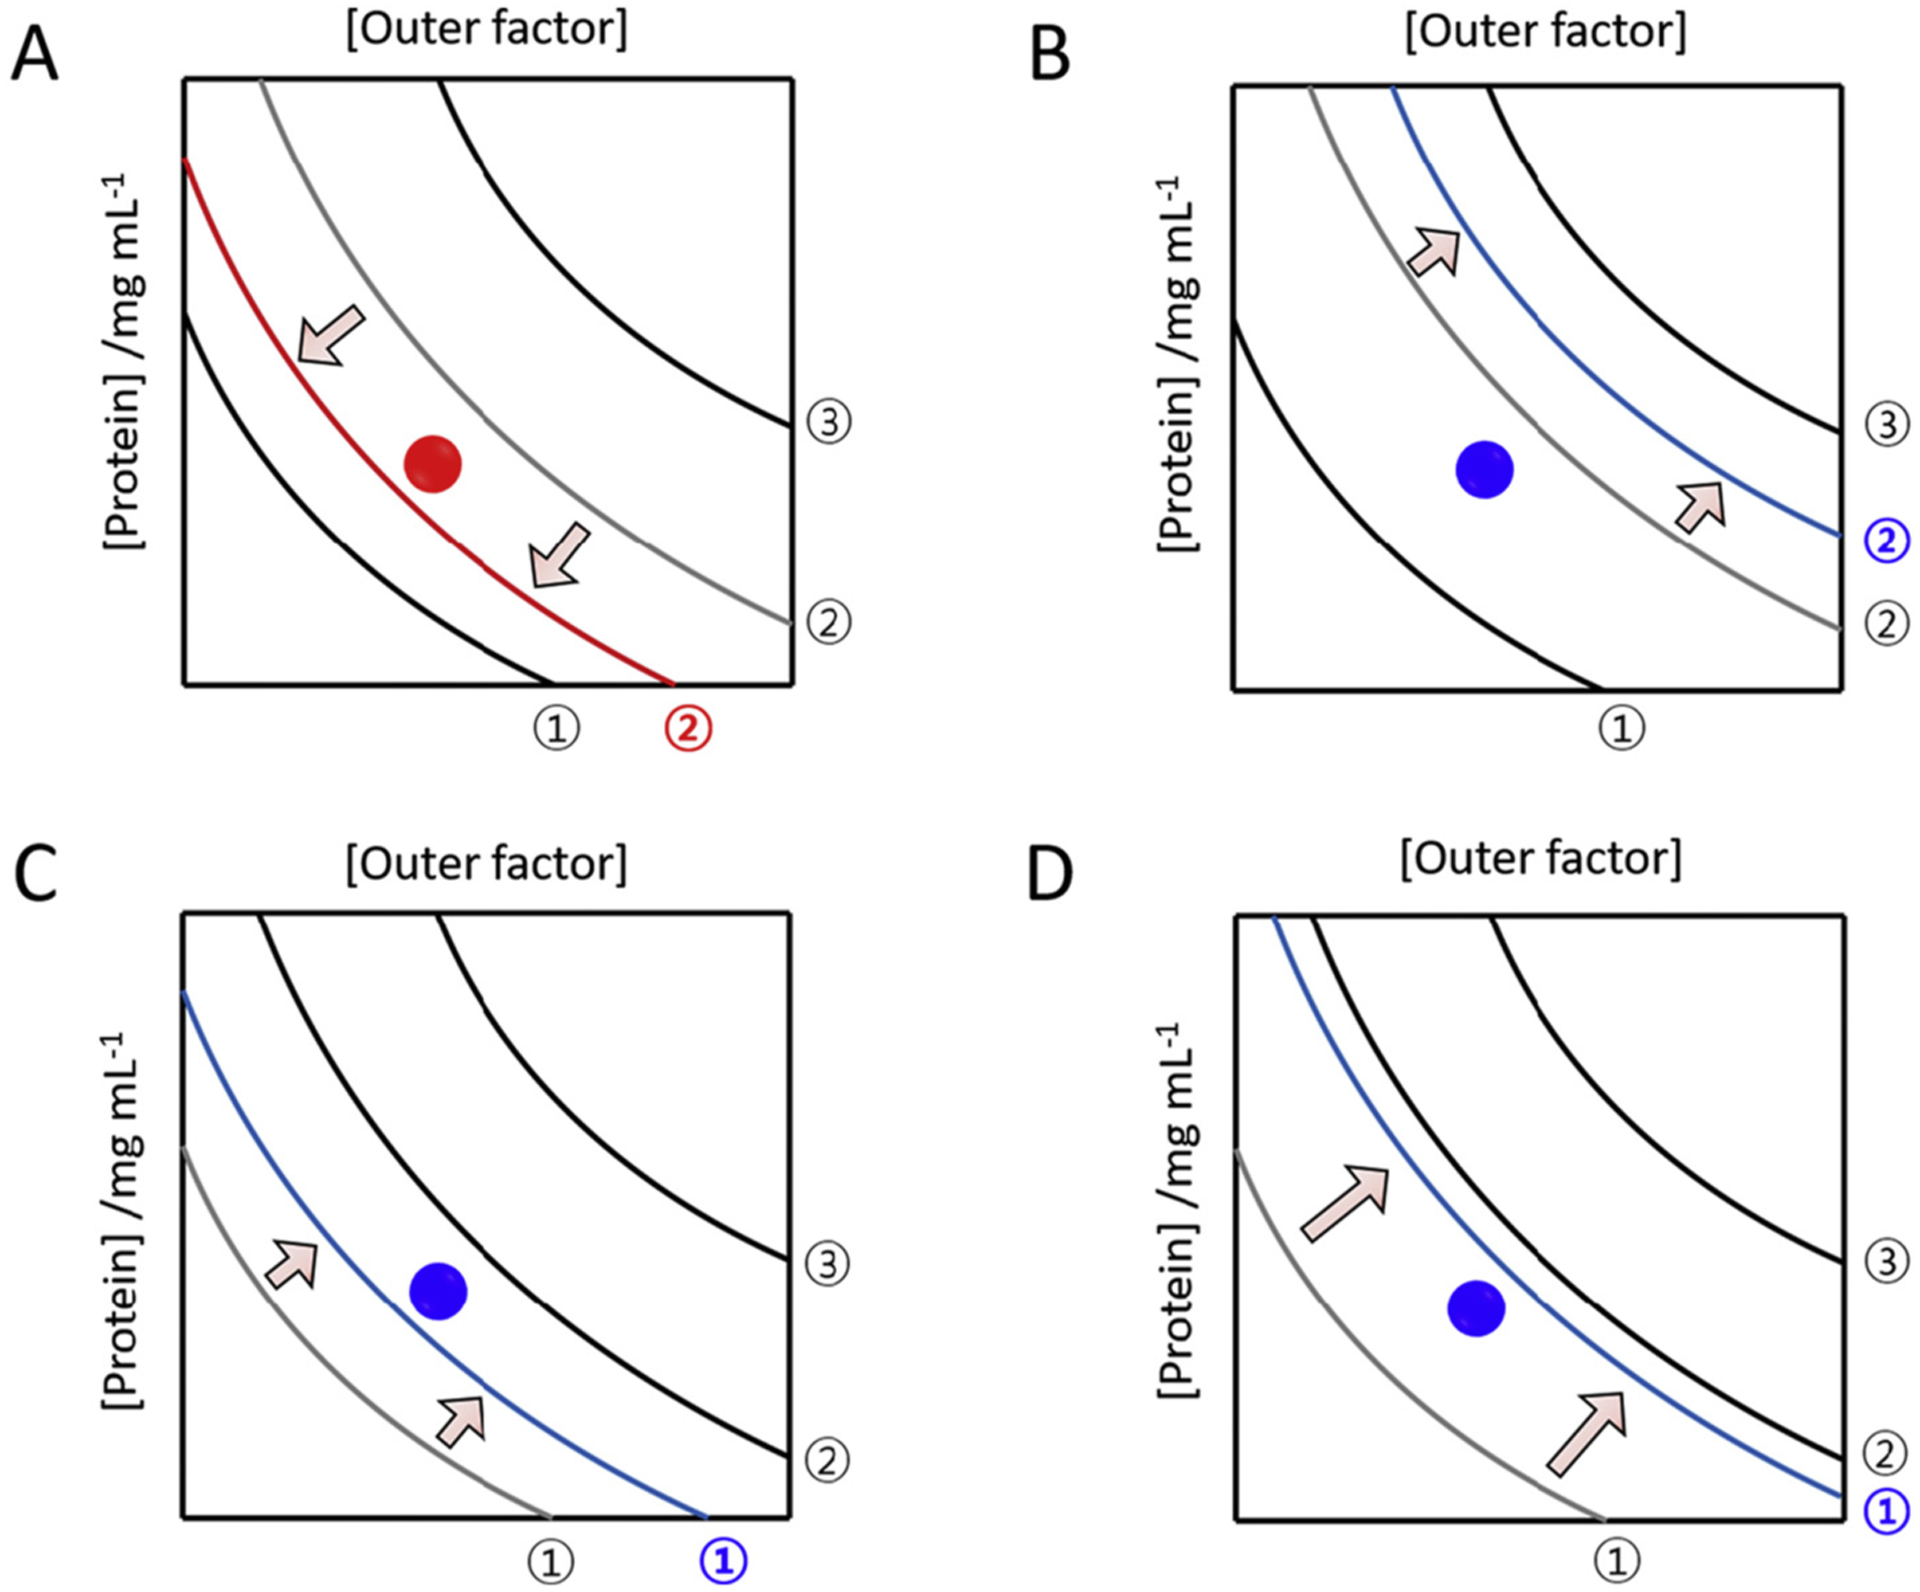
Phase diagrams showing the effects of cross-seeding on amyloid generation. Promotion (A) and inhibition (B–D) of amyloid generation due to cross-seeding are represented using phase diagrams. Amyloid proteins under given conditions are positioned with closed circles. It is assumed that the addition of cross seeds does not change the position of precursor amyloid proteins in the phase diagram. Curves in the presence of external amyloid seeds, or soluble amyloid proteins, are colored in red for promoting effects and blue for inhibiting effects. Curves prior to cross seeding are colored in gray and their corresponding shift is guided by arrows. Regions with distinct phase properties, curves (black and gray), and x and y axes are the same as explained in Fig. 8.