
Fig. 1.
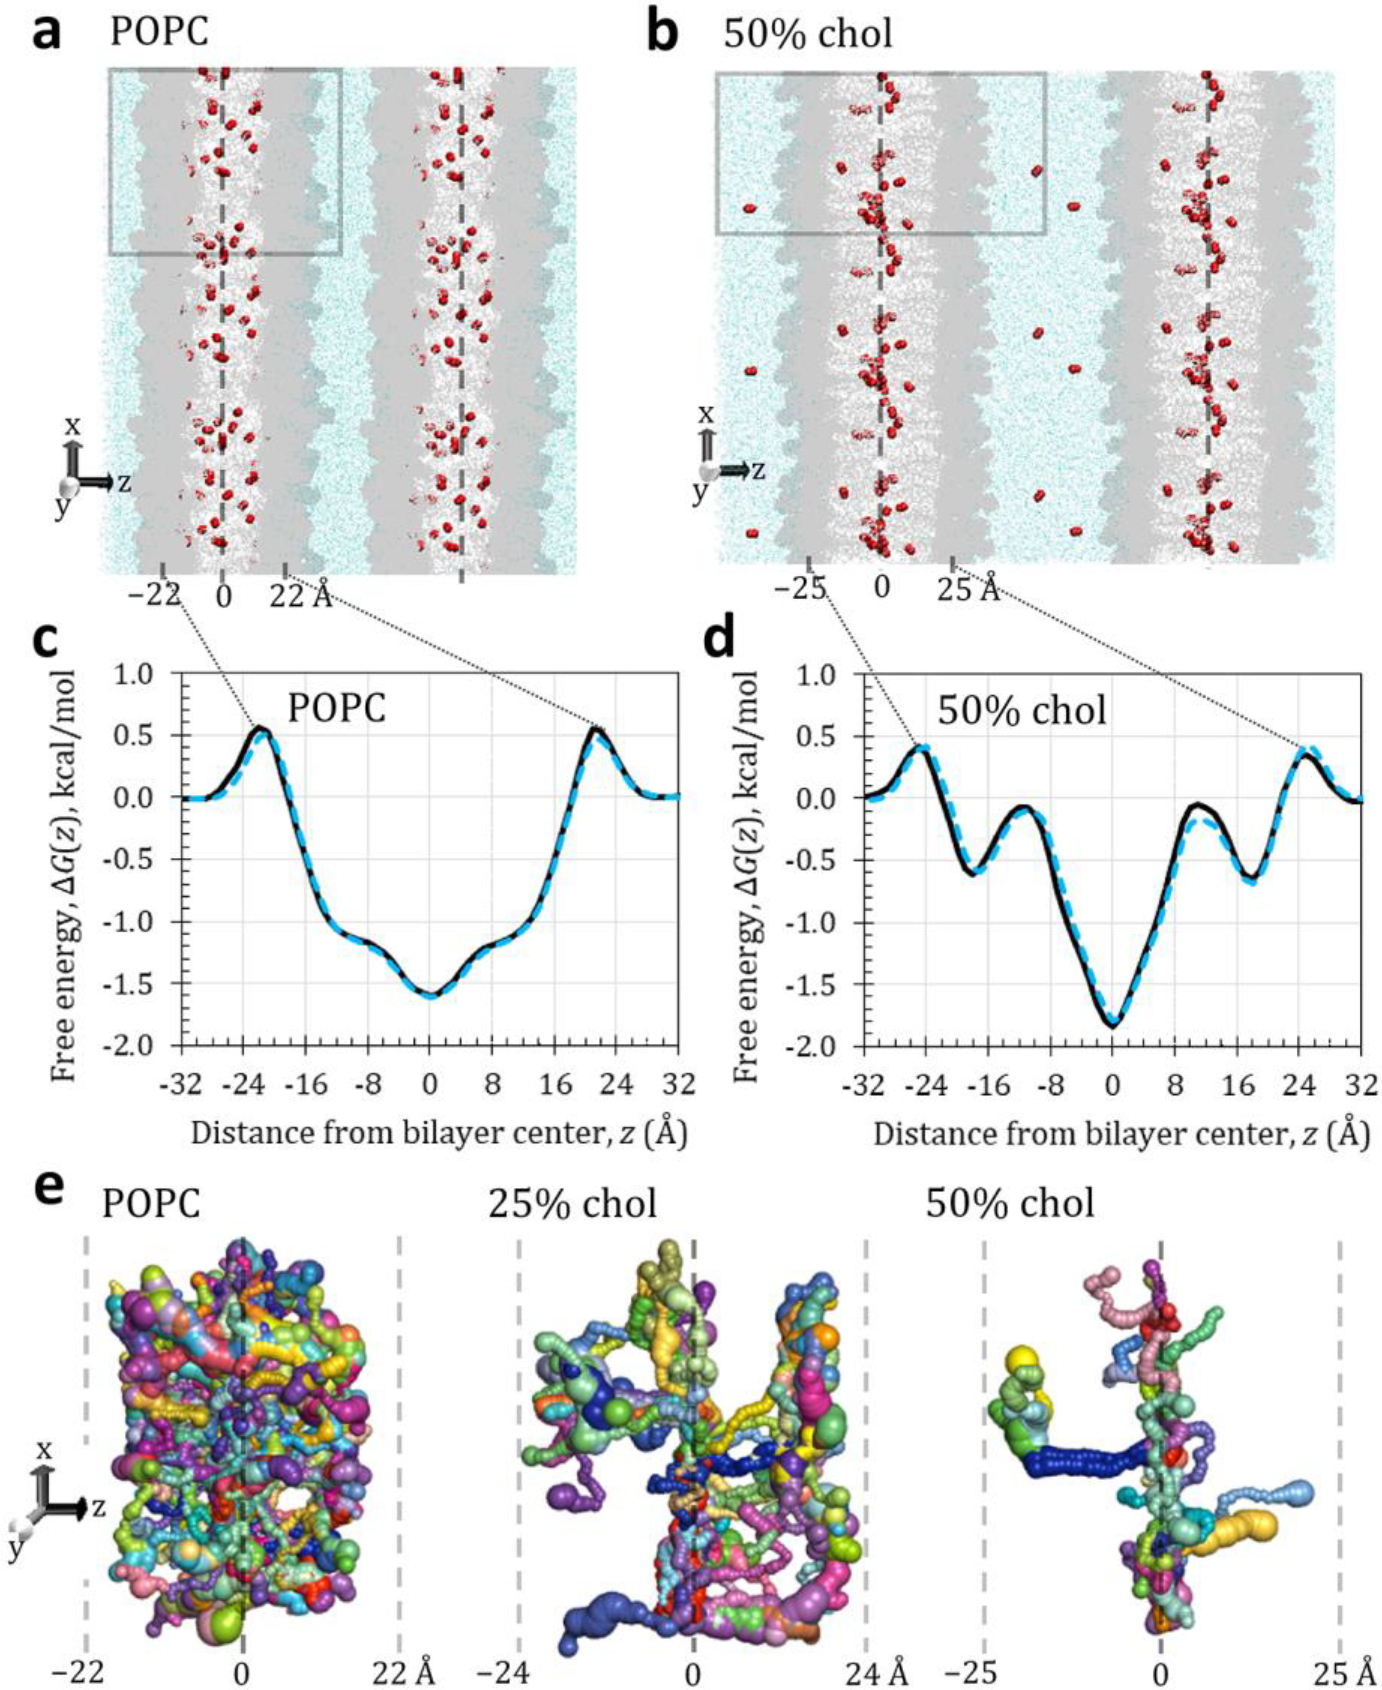
(a, b) Representative simulation snapshots for POPC and 50% cholesterol, showing the primary simulation box (gray outline) with composition specified in Table 1 and adjacent images to illustrate the periodic boundary conditions. The simulation “sees” an infinitely wide bilayer in both x and y dimensions and an infinite number of membrane and water layers in the z dimension. O2 molecules visualized as red spheres, water as light blue dots. POPC and cholesterol shown in gray (darker areas are POPC headgroups). Labels indicate approximate positions of bilayer center and headgroup-associated free energy barriers. Dashed line indicates bilayer center. (c, d) Relative bilayer-depth-dependent free energy curves for O2 in POPC and 50% cholesterol, using the Langevin thermostat (black lines) or the Berendsen thermostat (dotted blue lines). (e) Void pathways within each bilayer, oriented as in panel b but displayed at larger scale. Shown are continuous pathways generated from 10 consecutive trajectory snapshots spaced 1 ps apart (covering 10 ps of simulation time), using a 0.75-Å probe to identify empty volumes transiently devoid of atoms. Voids large enough to contain the probe are pictured as spheres, which are connected into pathways through occurrence of neighboring voids in consecutive snapshots. Sphere size represents void volume. Locally continuous pathway segments are distinguished by color. Labels and dashed lines indicate approximate bilayer-depth positions in ångströms.