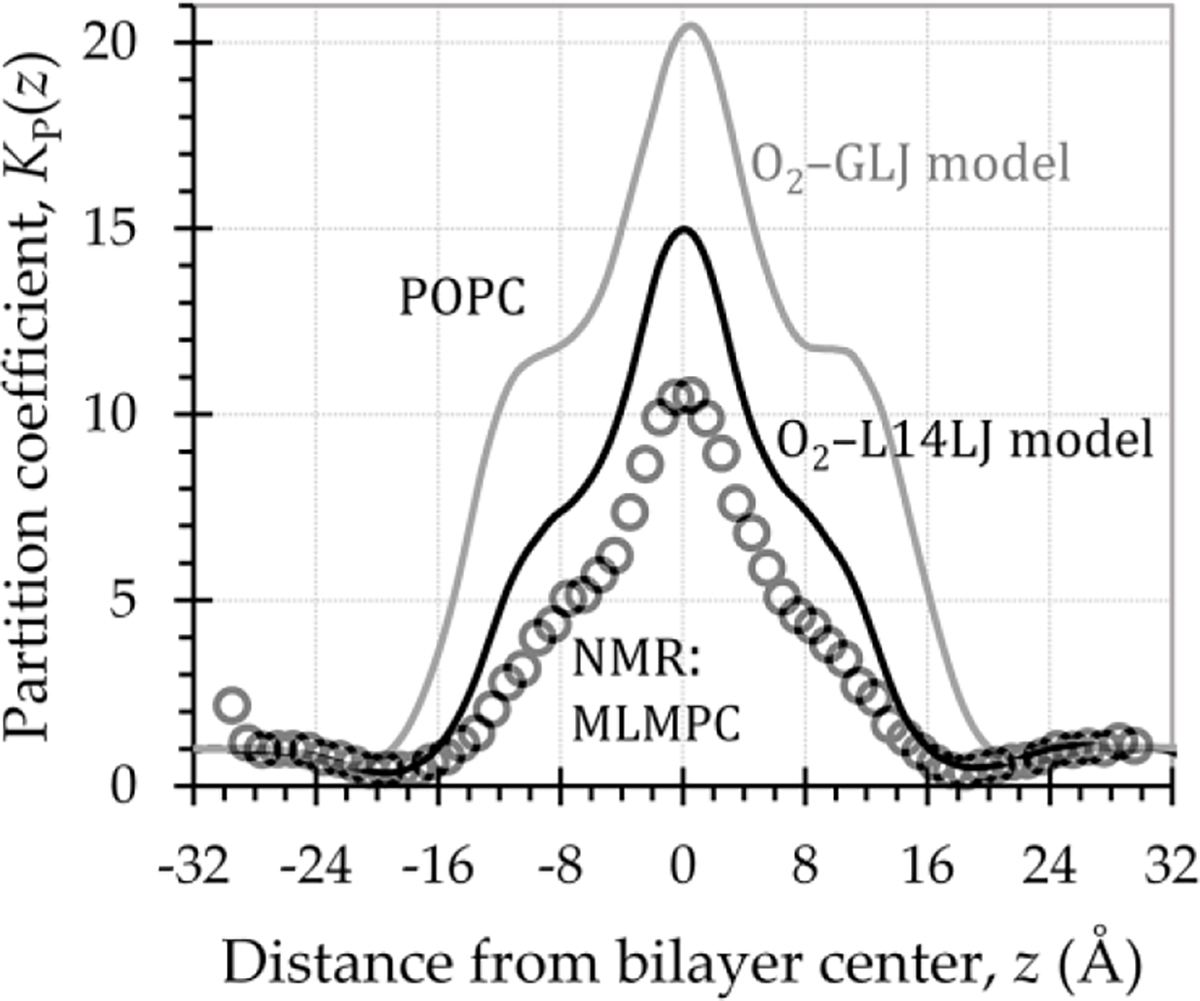
Fig. 2.

Depth-dependent O2 lipid–water partition coefficient curves, , showing improved partitioning for the updated O2–L14LJ model (black line), relative to the original O2–GLJ model (gray line). Circles represent calculated from experimental NMR data [27], for O2 in MLMPC at 318 K. Simulations used POPC at 310 K, with Langevin temperature control (collision frequency 1.0 ps−1) and the Monte Carlo barostat.
