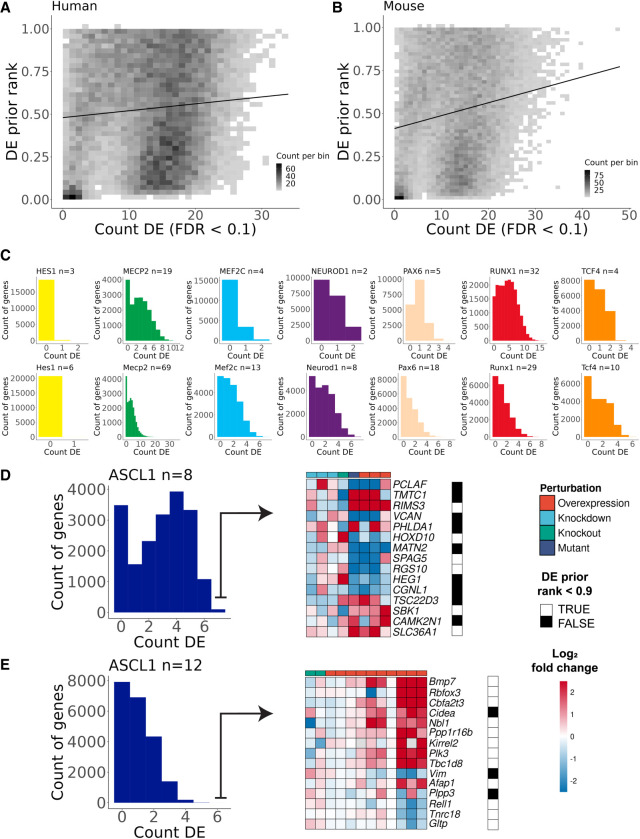
Figure 5.
Demonstration of genes with recurrent differential expression (DE). (A) The x-axis is the count of times that a gene was DE across human experiments in the current study (n = 77), and the y-axis is the DE prior rank, where 1.0 represents the gene that was most likely found as DE across a large and diverse corpus of expression experiments. (B) Same as in A but for mouse experiments (n = 165). (C) Histograms of the count of times genes were DE across each group of TR experiments (top row, human; bottom row, mouse). (D) Demonstration of the top 15 genes by DE evidence for human ASCL1. FCs are clipped at [−2.5, 2.5] for plotting. The DE prior was binarized so that values above 0.9 (black squares) represent genes that are commonly DE regardless of design. (E) Same as in D but for mouse ASCL1.

